Built for energy risk onshore and offshore.
A mature, production-ready module purpose built for energy sector exposure management. Available for immediate deployment for clients writing upstream, downstream or power generation risk.
- Pre-built data formats for energy asset classes
- Upstream, downstream and power generation
- Ready to deploy, without configuring from scratch
Platforms, refineries and plants, where they actually are.
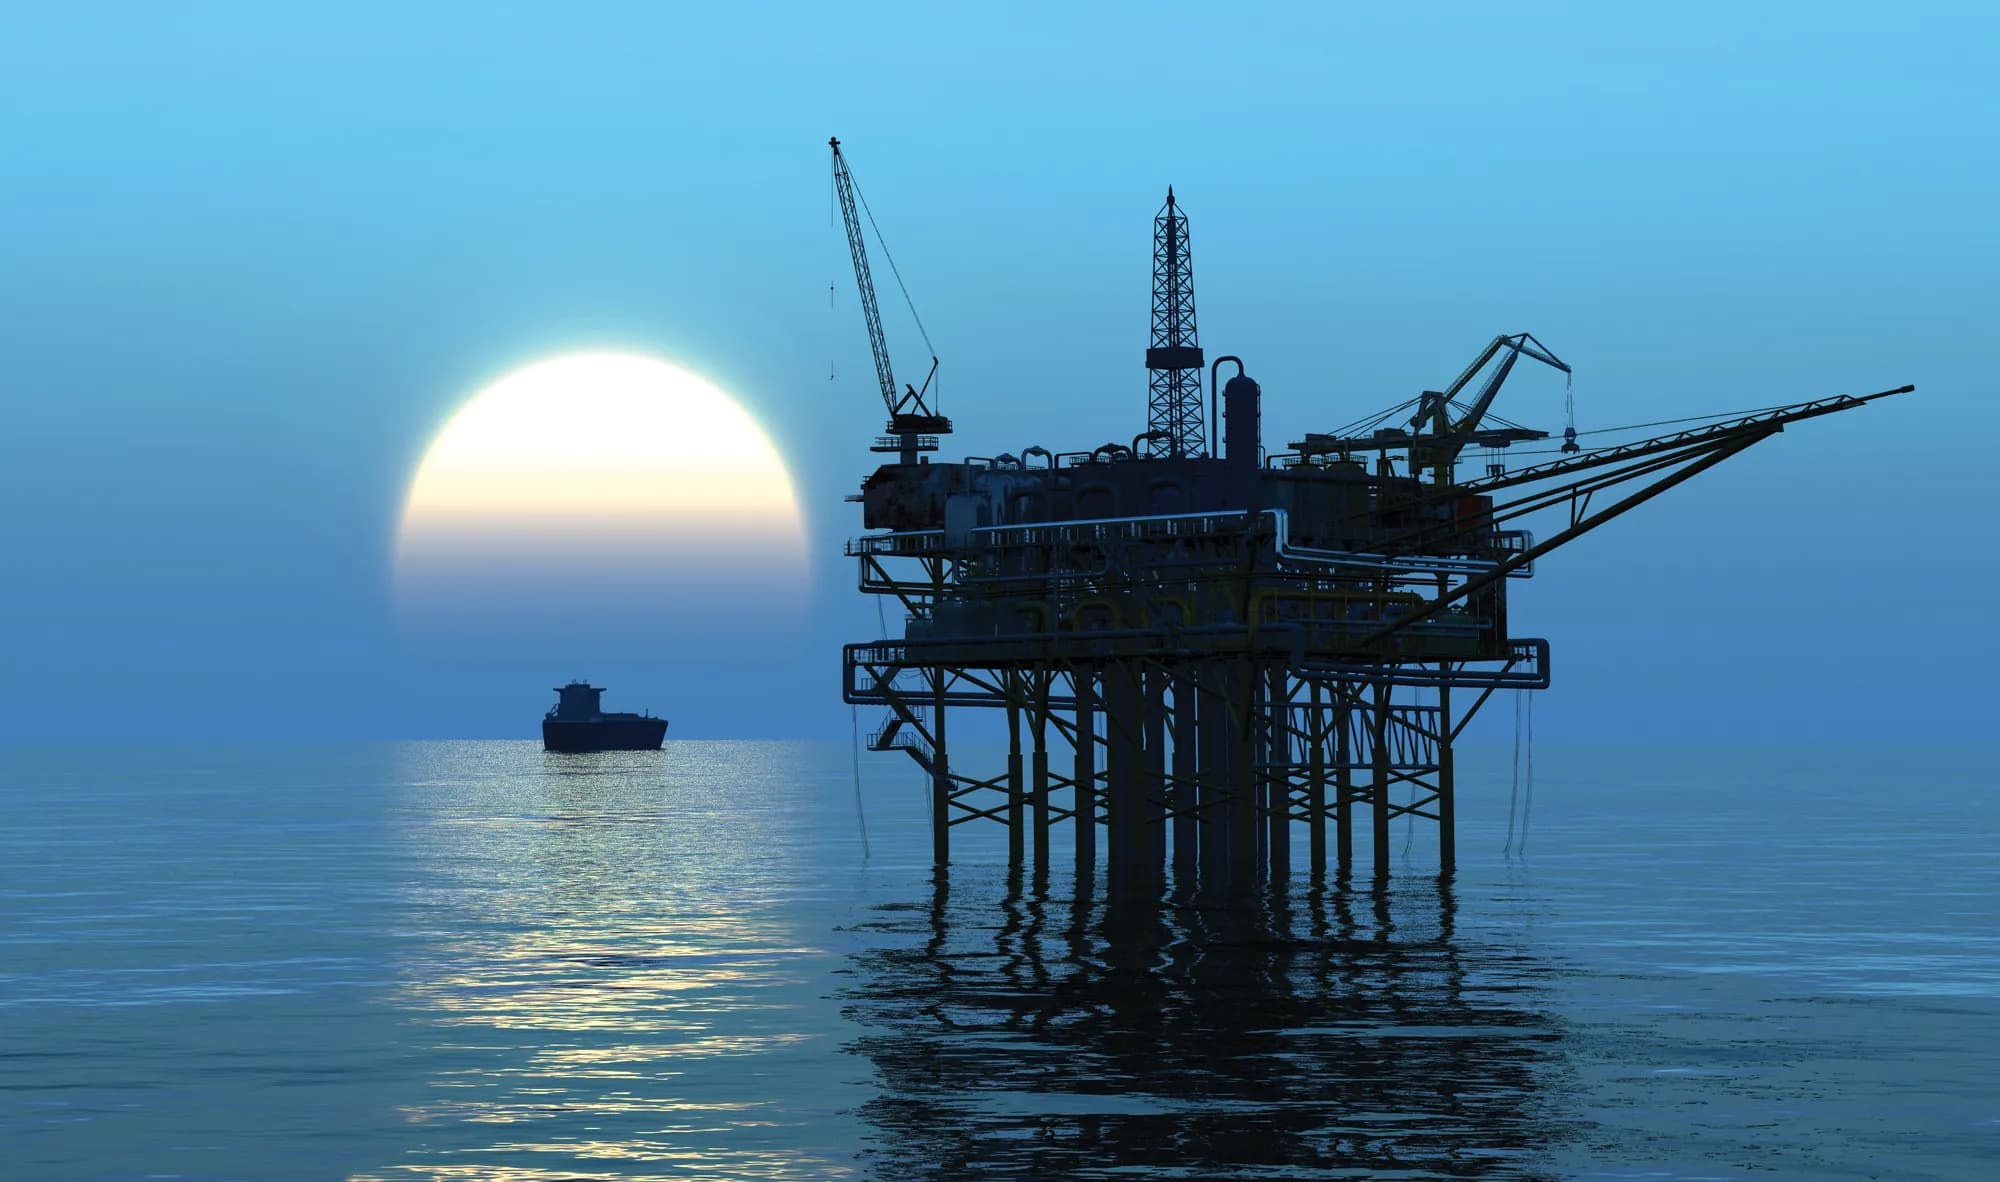 Image: ExposureHub brochure

Split the book by stage of the energy chain.
What accumulates
Offshore platforms and rigs
Facilities concentrated in one basin and exposed to the same marine and weather conditions.
The question it answers
“How much upstream exposure do we have in this basin?”
Place platforms, plants and facilities where they actually are.
Asset location geocoding for offshore and onshore facilities. Each is placed by its coordinates, so a platform in one basin and a plant on one coast show up as the accumulations they are.
Real geography; no exposure data is implied.
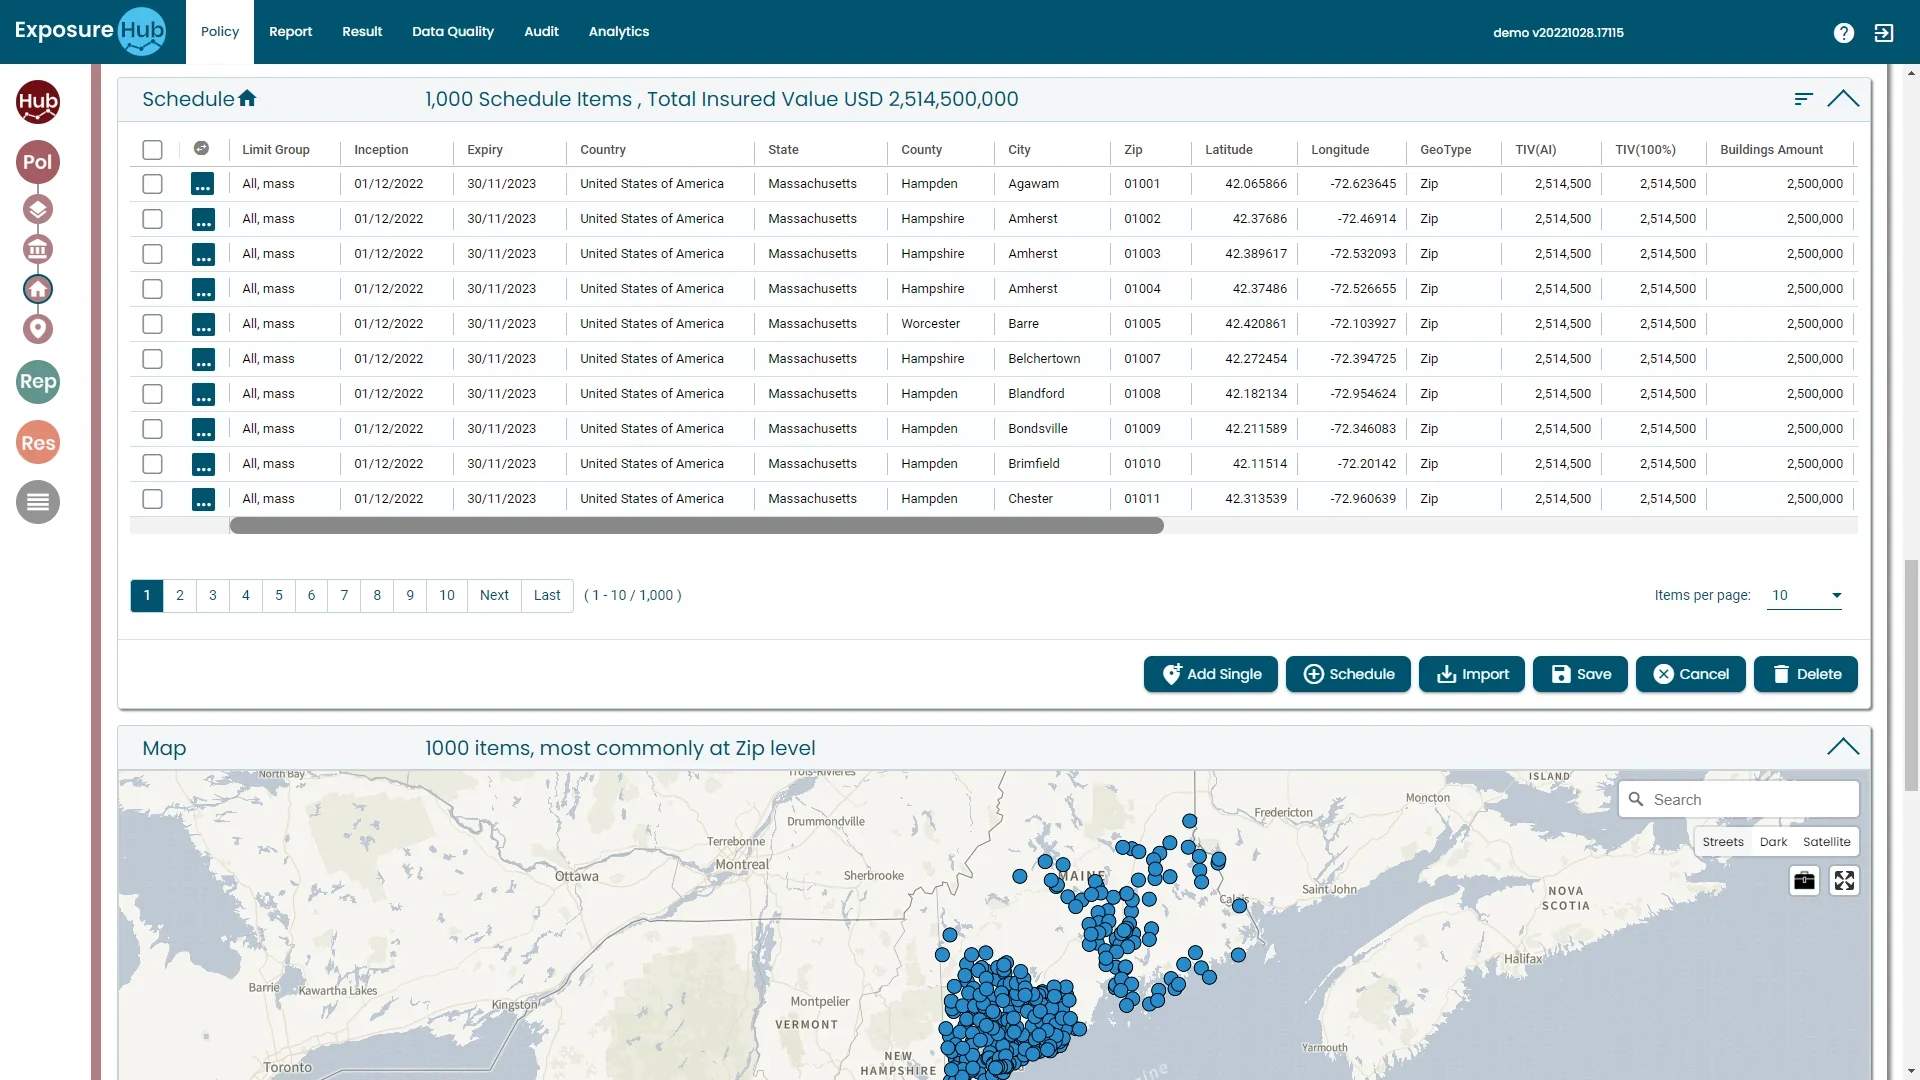
Model scenarios against the geocoded book.
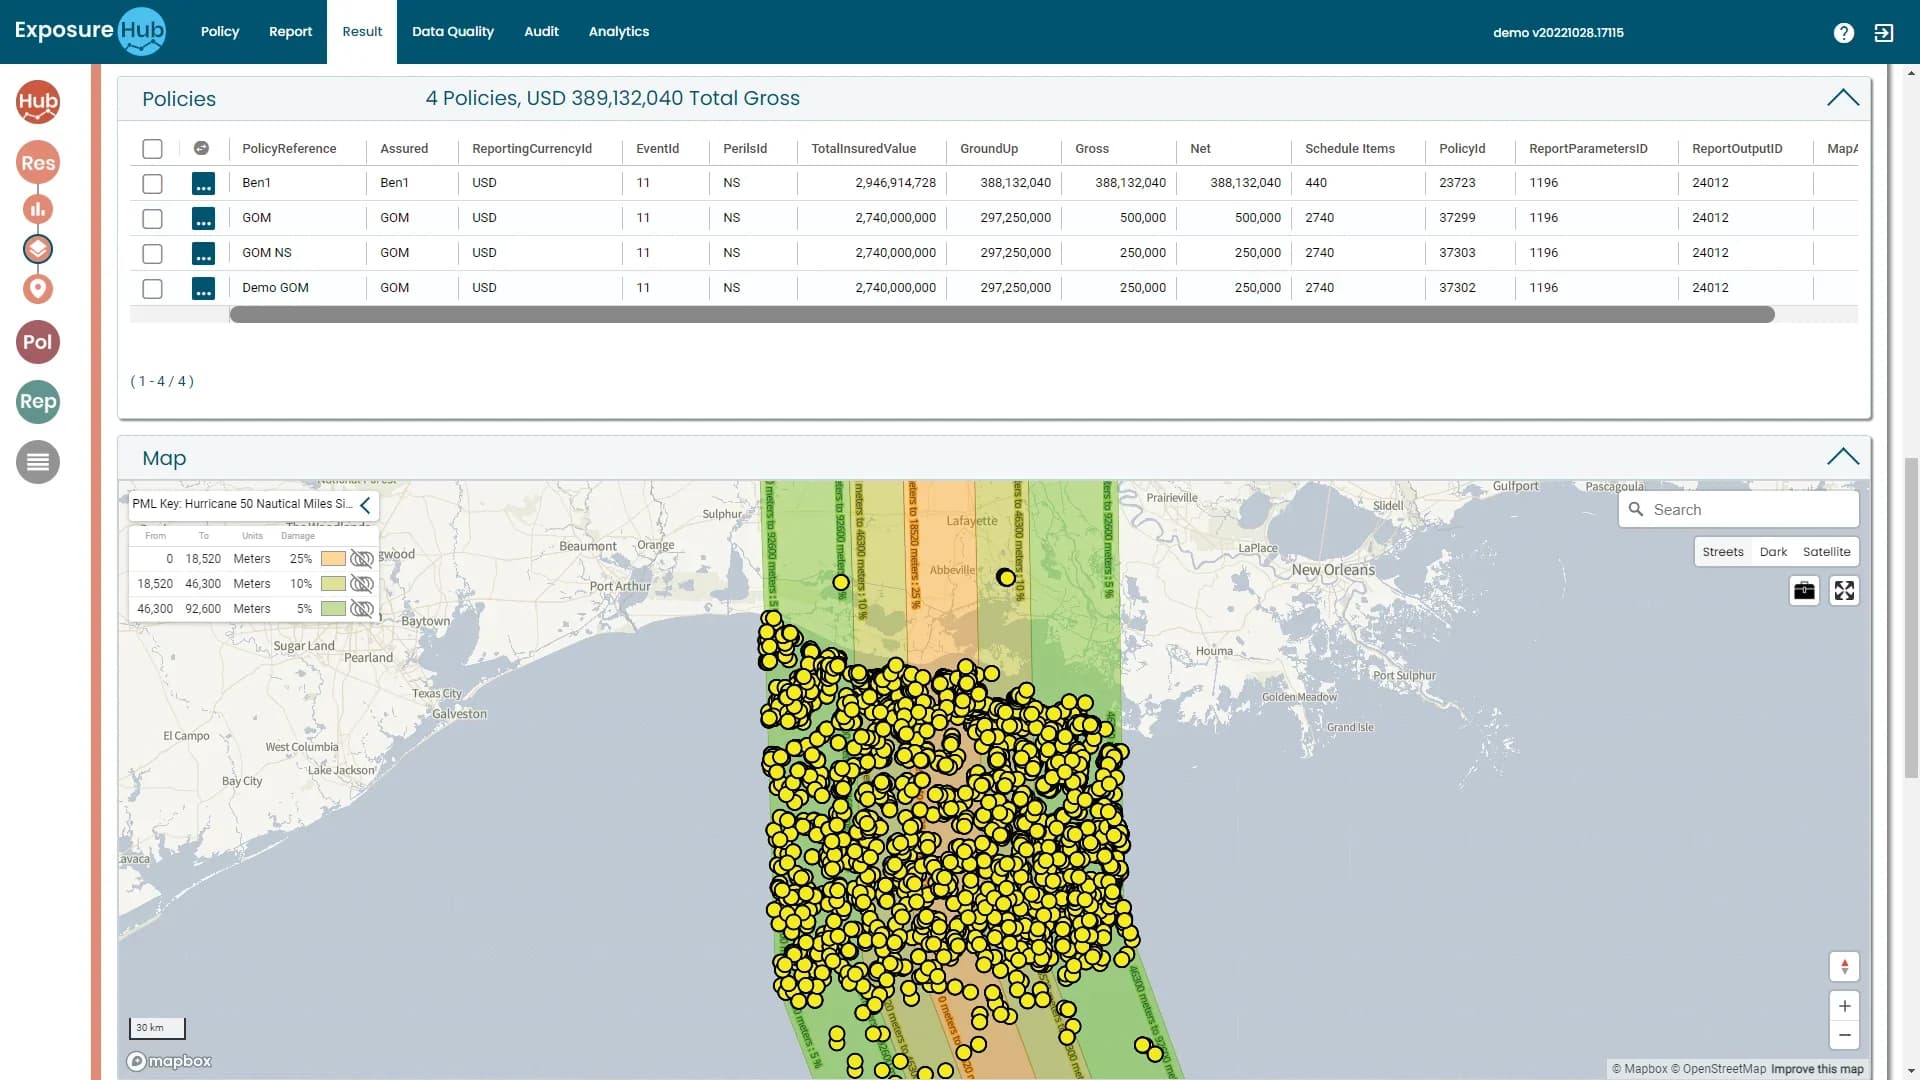
Shape, offset, damage factors
Draw a hotspot or a storm, set the offset and damage factors, and read policies, ground-up, gross and net back from the Result tab.
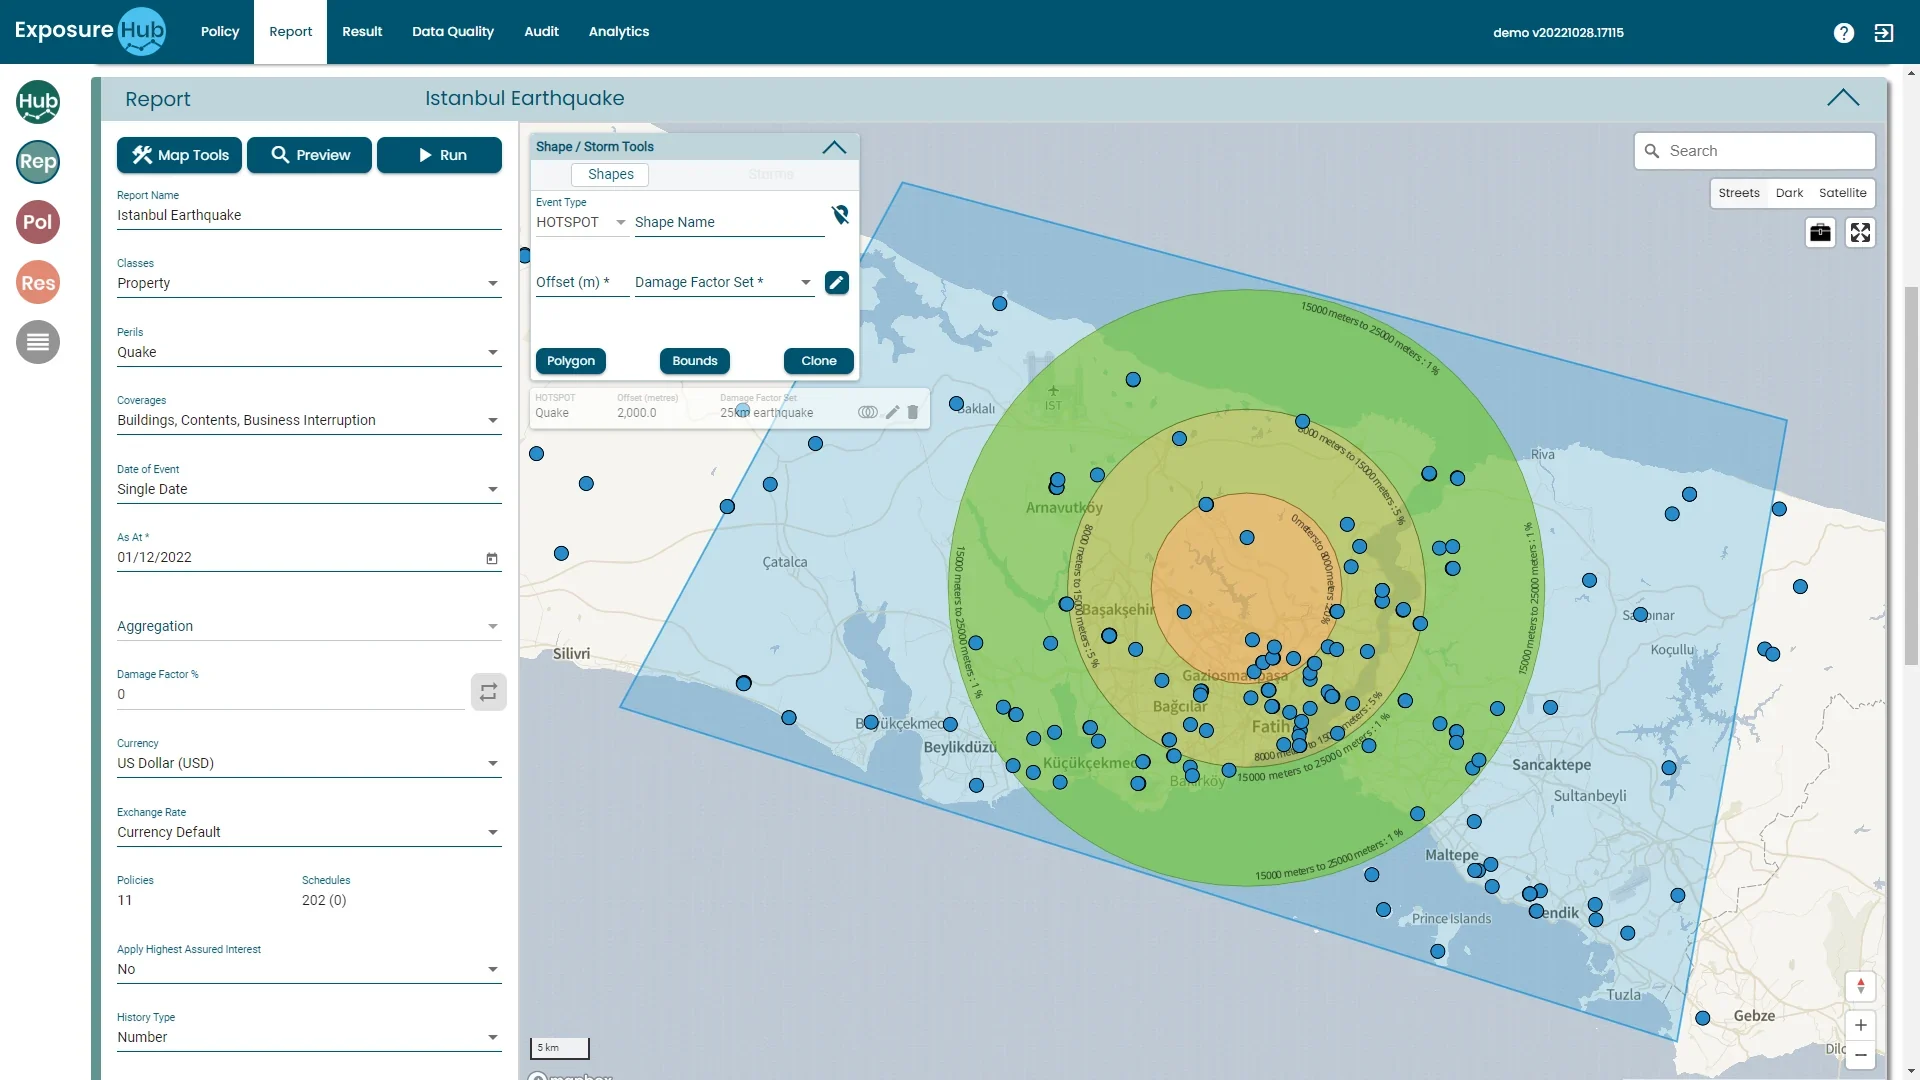
Model scenarios against the geocoded energy book.
Result and Report tabs · ExposureHub demo environment · sample data
From schedule to scenario, in four moves.
Bring the schedule
Load energy asset schedules in energy-specific formats.
Place the assets
Geocode offshore and onshore facilities.
Segment
Split by upstream, downstream and power generation.
Scenario
Run energy loss scenarios over the book.
Keep going: the rest of the platform.
Also in the platform
Or go back to the overview.
See Energy Module in action.
Book a walk-through of this module on your own data, with your own questions.