When it happens, know within hours
When a storm, quake or flood is under way, the first question is what you have in its path. Real-time exposure visibility means the answer is on a map, not in a spreadsheet someone has to build.
- Event footprint over the book
- Post-event loss estimation
- Scenarios before the event
Draw the event over the book, read the answer.
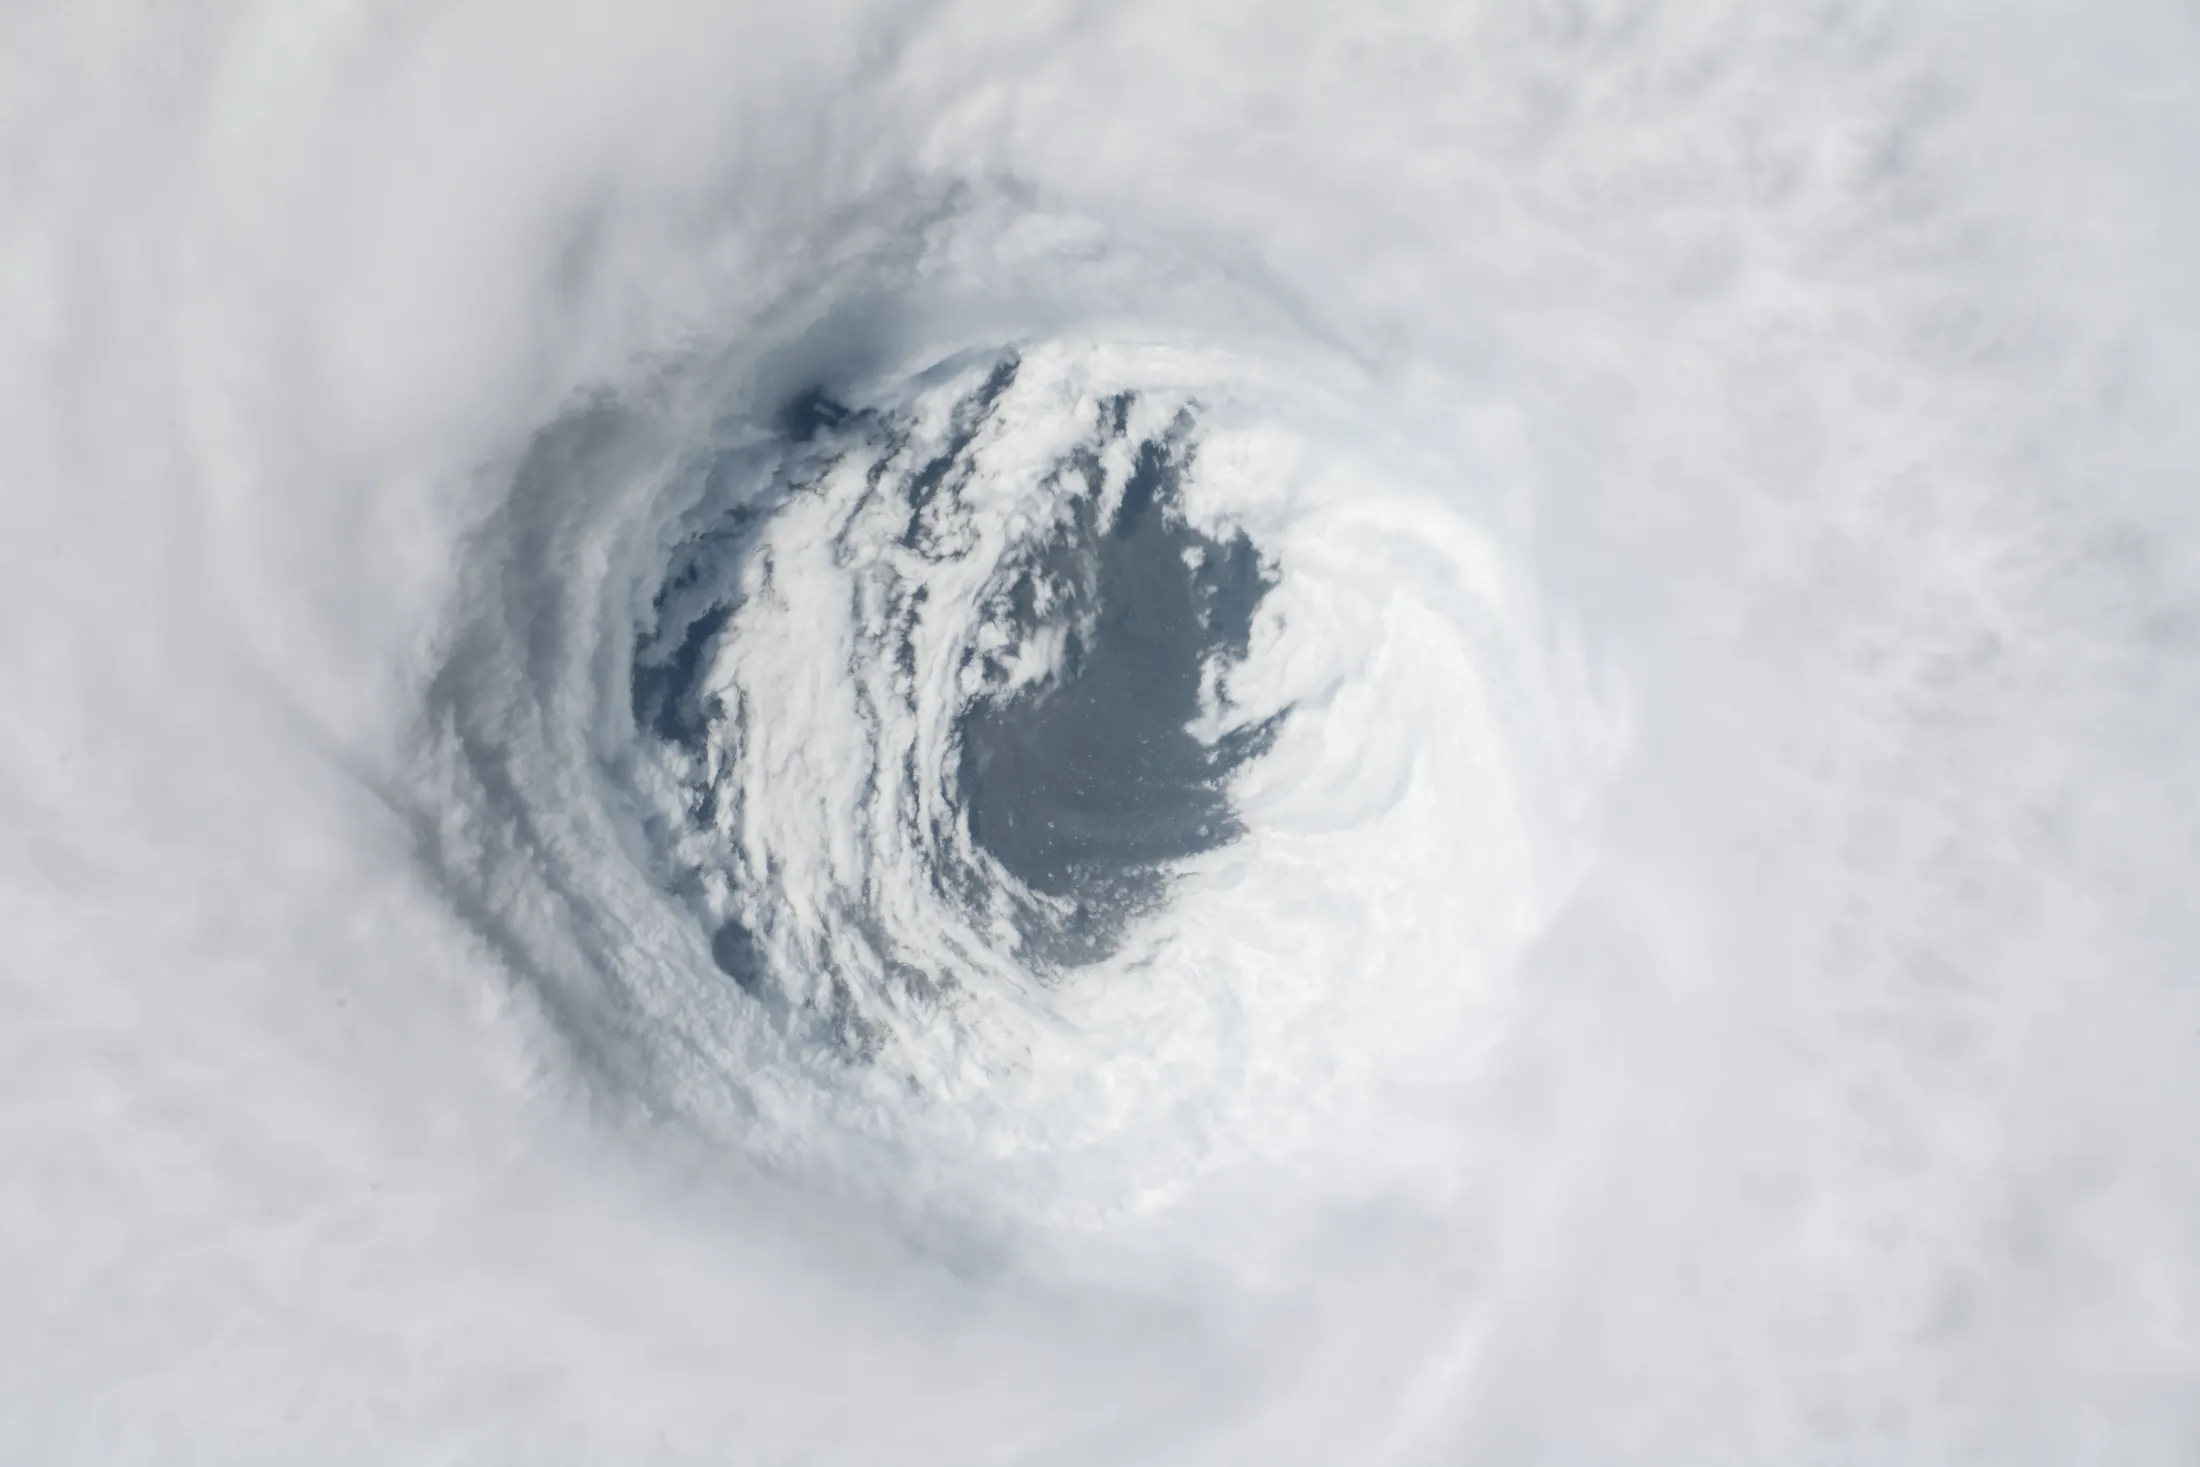 Photo: NASA

inside the swath, USD 389m gross.
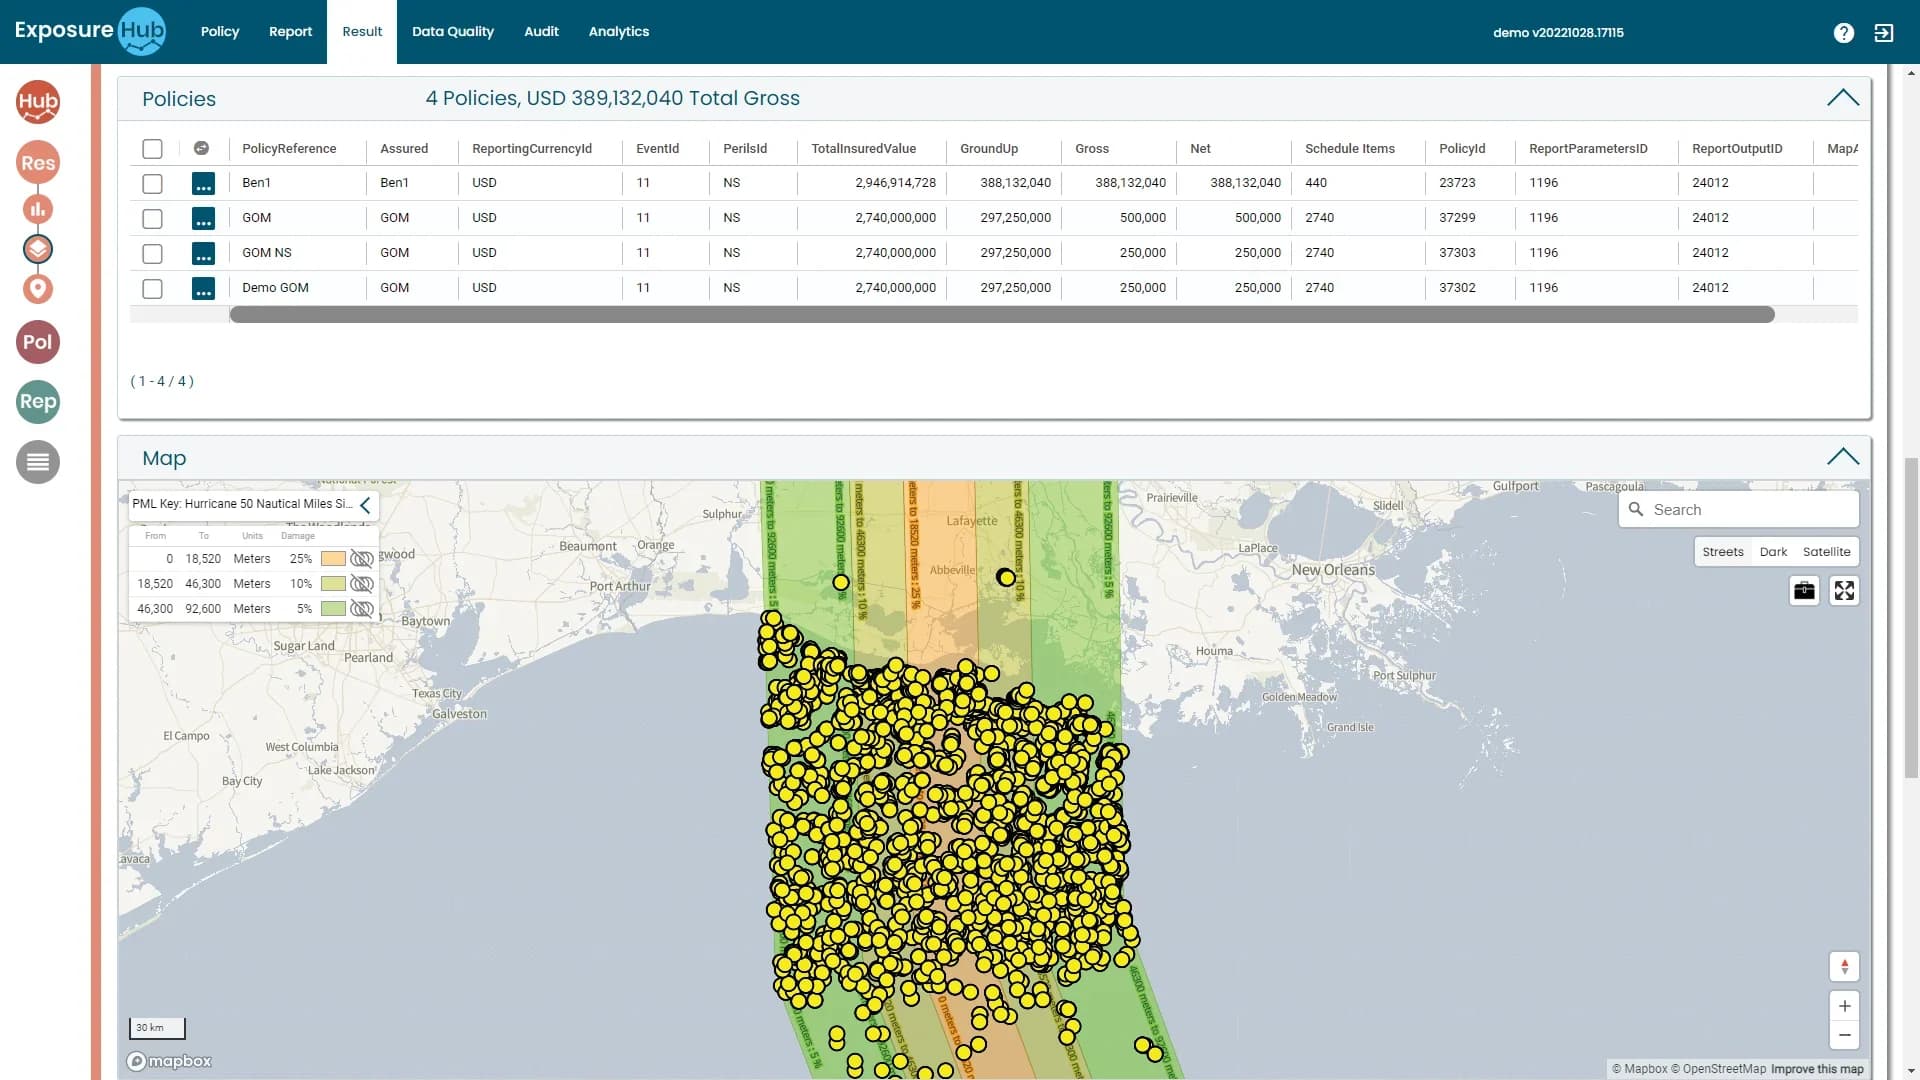
One event, from the scenario to the loop that follows.
Run it in advance
Scenarios run before the event tell you where you are most exposed. Choose the class, the peril and the coverages, draw the event, give it a damage factor set.
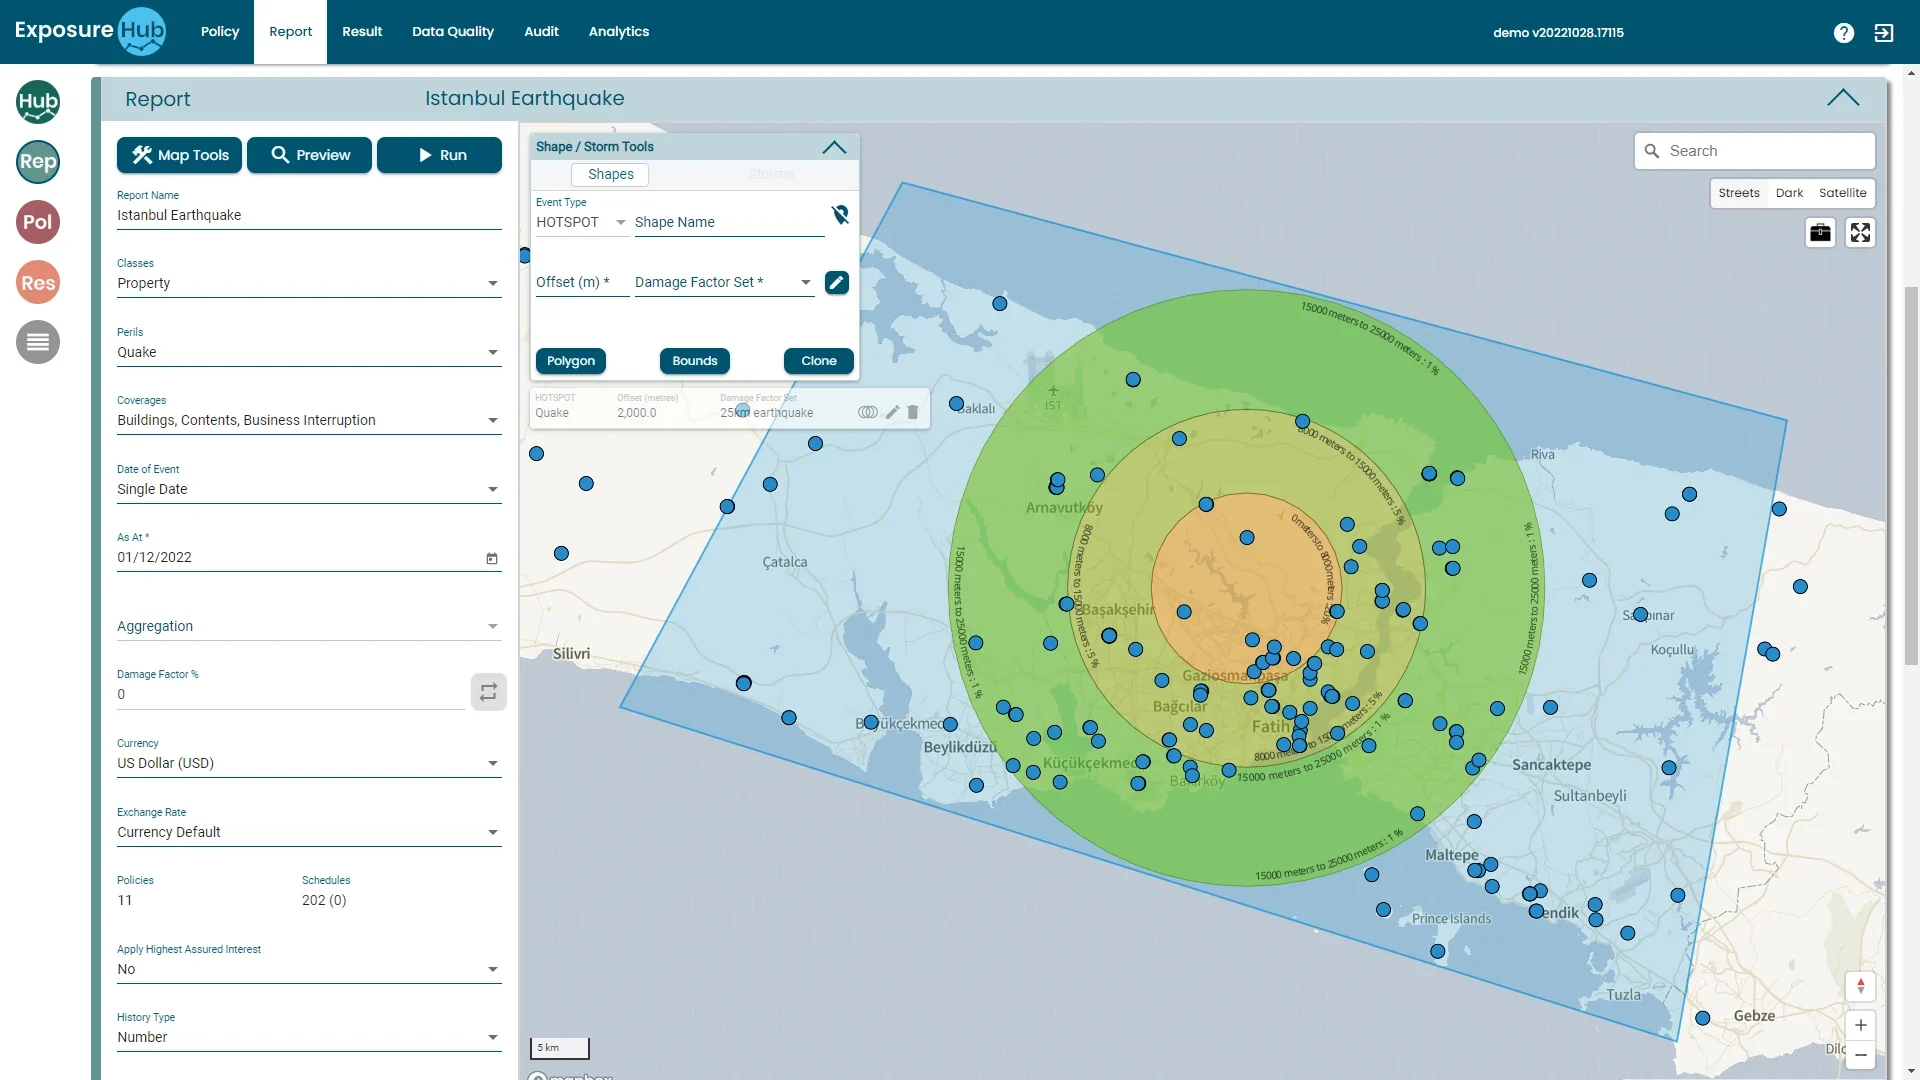
ExposureHUB demo environment · demo policies
Why a live view matters: the picture has to keep up.
Days mattered
The Iberian blackout
Claims surged simultaneously across business interruption, property, travel and personal lines, and the picture was fragmented, incomplete or locked in silos.
Hours mattered
The M&S, Co-Op and JLR cyber attacks
They rippled across suppliers, logistics partners and millions of customers; where exposures started and ended was hard to trace.
Ebix Europe, “Seeing clearly in a crisis: why real-time exposure visibility matters”
The response starts long before the storm.
Before the event
Make the data trustworthy first
- Integrate third-party data sources such as satellite imagery, climate data and social media data for a more complete understanding of risk.
- Validate those sources and check for inconsistencies or errors; normalise them so they are compatible with the platform's data model; monitor them for changes.
- Ebix describes a platform that takes in data about events as they happen, during a hurricane for example, as the direction it is working towards.
After the event
Feed what you learn back in
- Assess exposure, evaluate losses, model potential losses, update risk models, and share information with reinsurers and other stakeholders.
- By combining claims data with exposure data, insurers can estimate losses more accurately and make more informed decisions about claims settlement.
- By analysing portfolio data they can identify the policies and regions most at risk and prioritise their response.
Ebix Europe, “Lloyd’s syndicate business plan bulletin: accelerating improved exposure management”
Modules behind it, and the next job.
Put catastrophe response to work.
Book a walk-through built around your own classes of business and the questions your team asks of the book.