From a schedule of locations to a view of the whole book
Property is where exposure management began, and where it matters most: thousands of locations, each with a value and a set of physical characteristics, all exposed to the same weather and the same ground.
The task is to see which ones a single event can reach.
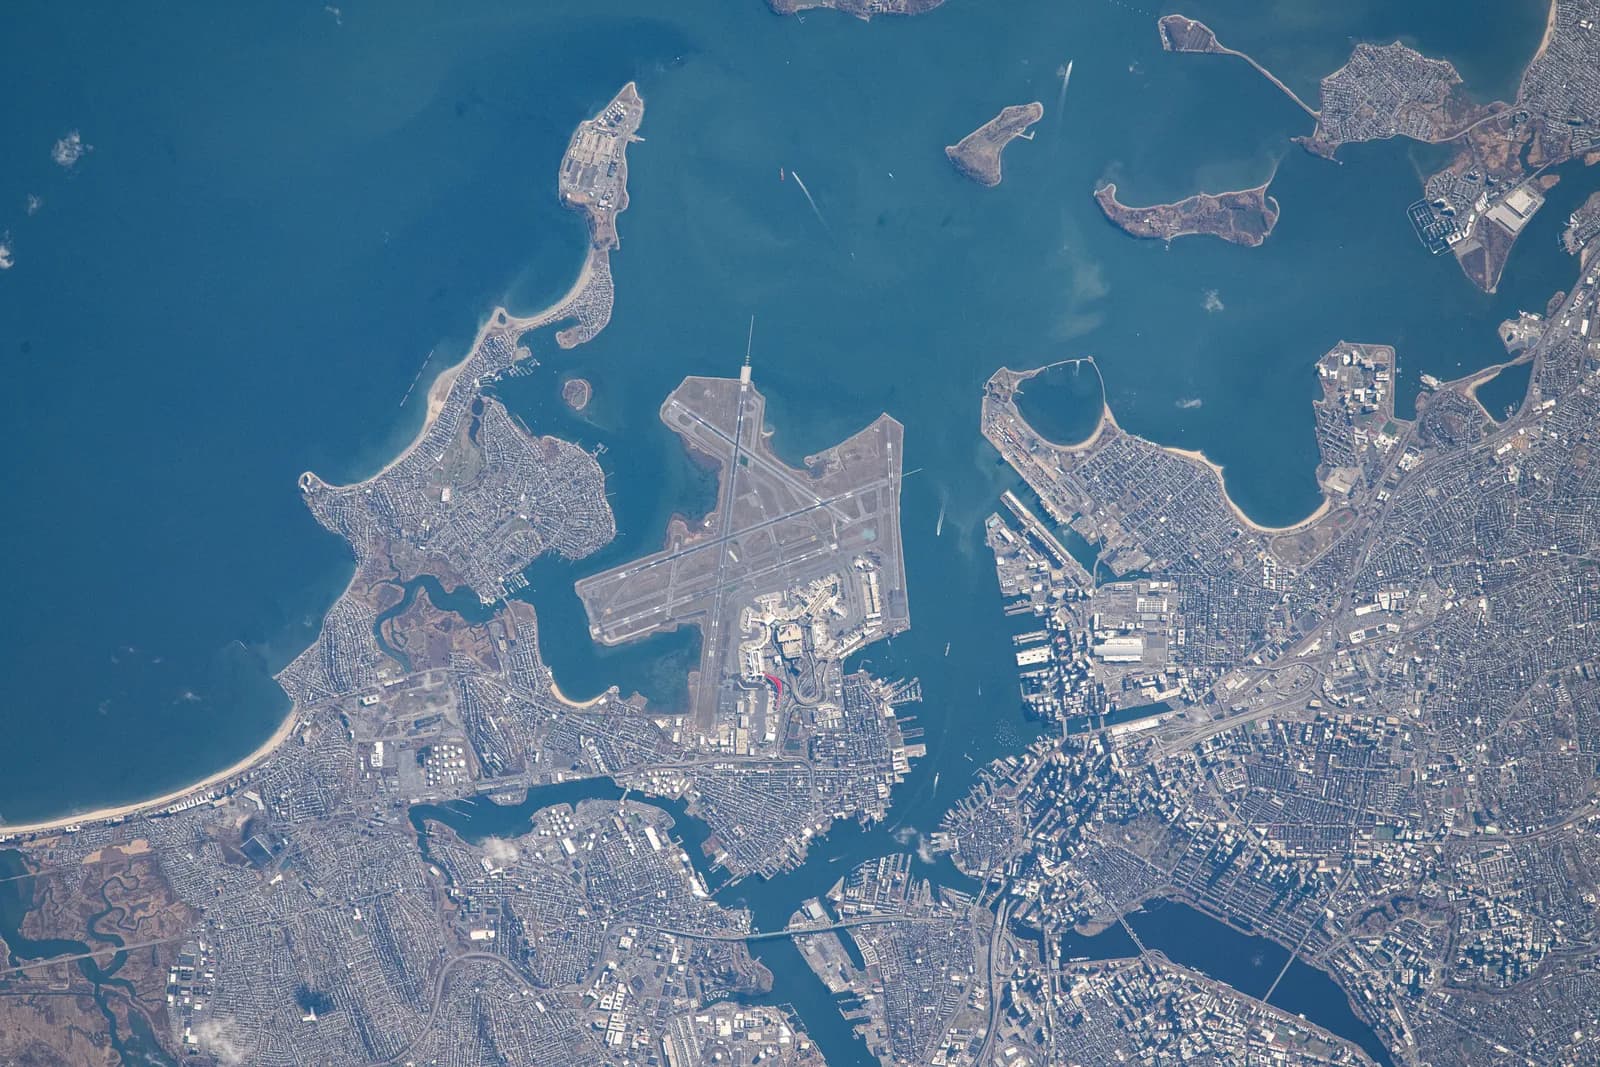
A coordinate for every row, an event on the map.
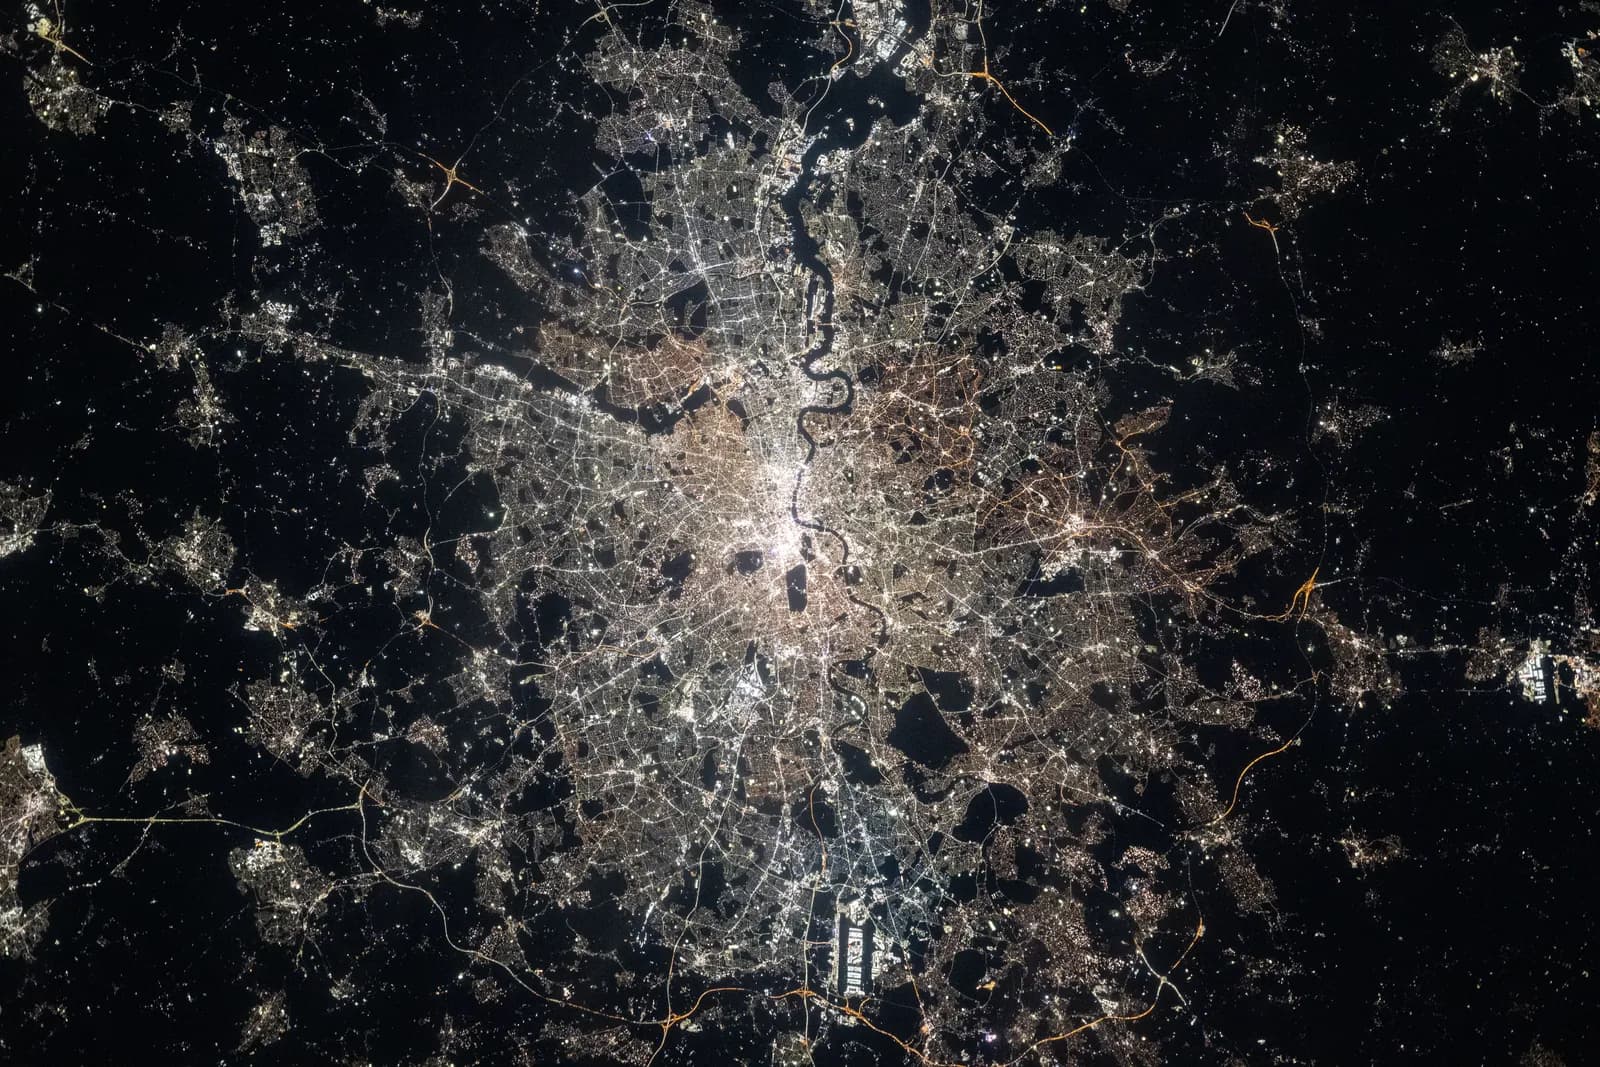 Photo: NASA

total insured value across 1,000 locations.
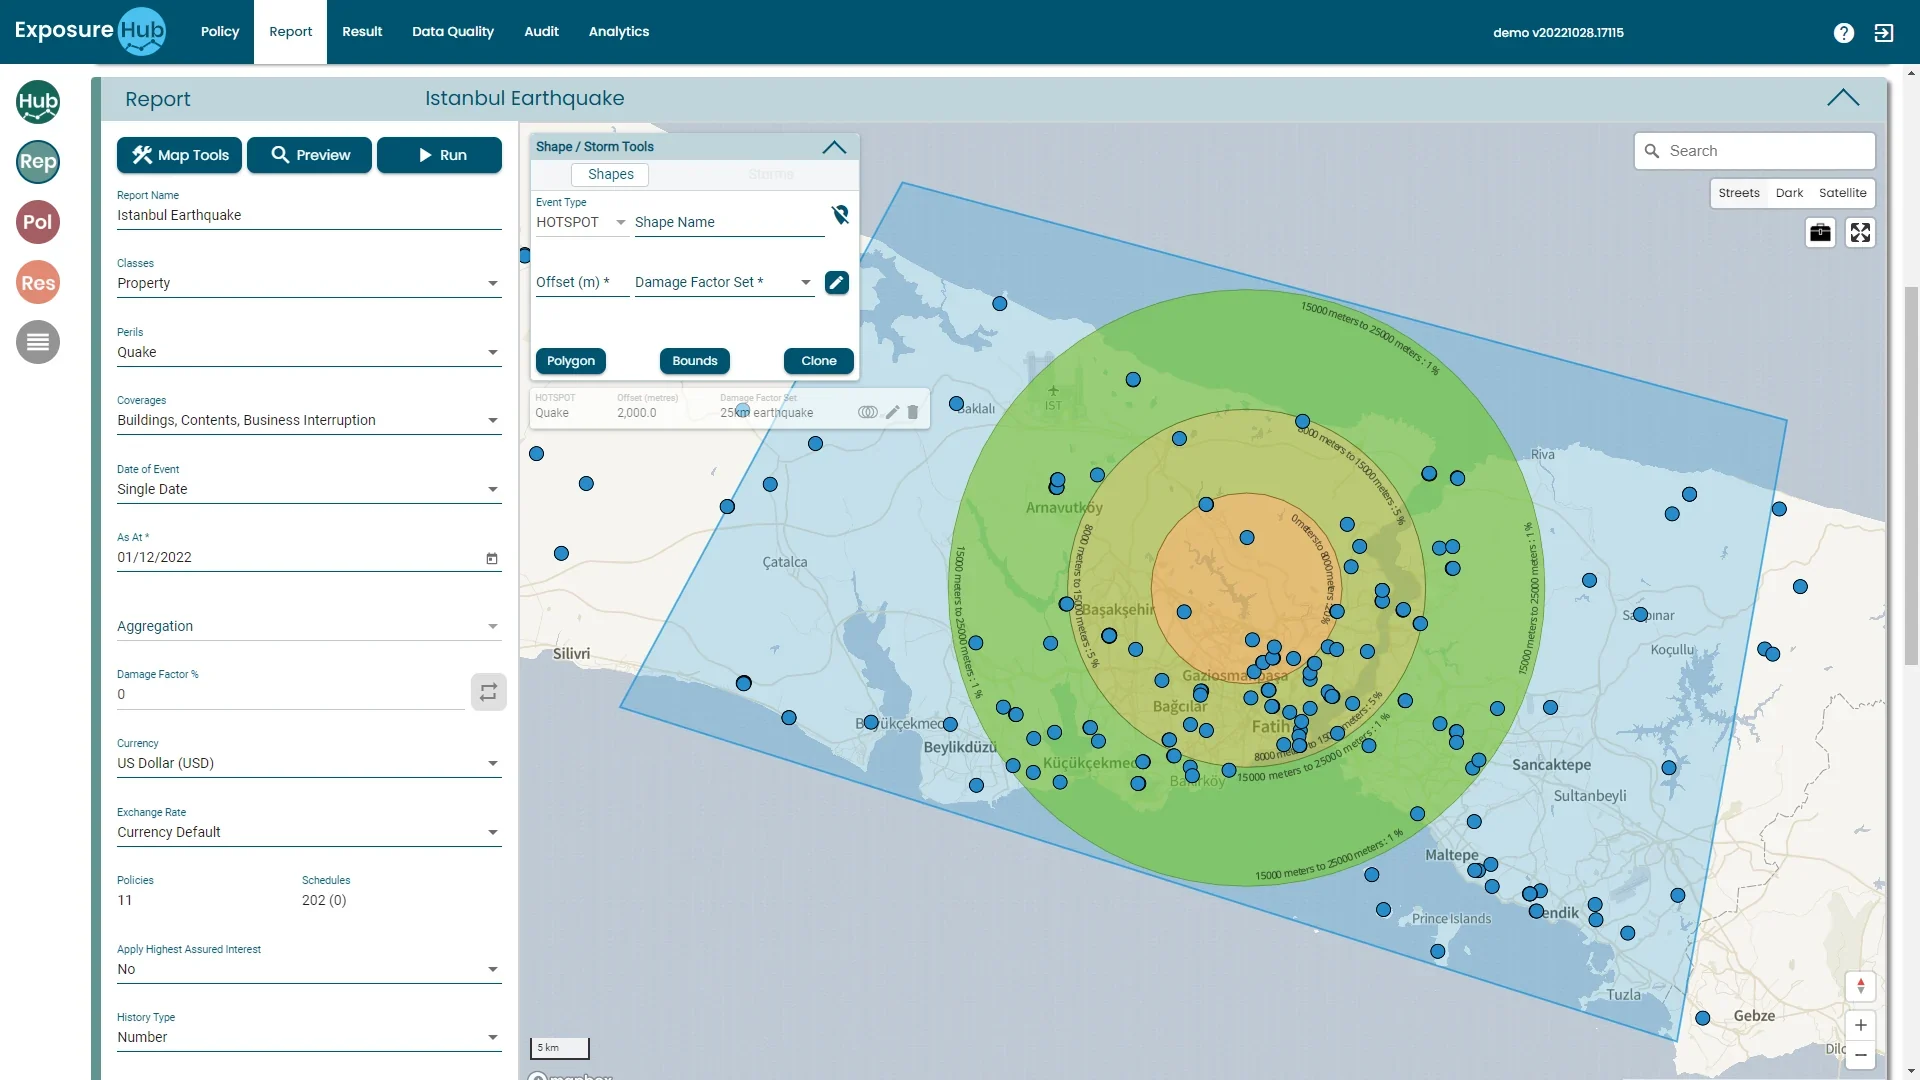
A quake strikes a city overnight. Which of our locations are inside the rings?
Nobody asks for the total insured value of the whole book. They ask for the value inside the first ring, then the second, then the third, split by client, by construction and by whichever team wrote it.
That answer used to be a week of spreadsheets. It is a schedule, a coordinate for every row, and an event drawn on a map.
The value of every location nearest the source.
Each further band out, with its own damage factor.
Written by different teams, split by client and construction.
Schedule, scenario, result: the real screens, in order.
Start with the schedule
A schedule of 1,000 items with a total insured value of USD 2,514,500,000. Each row has a value and a latitude and longitude; the map under the table plots every one.
- Import files, integrations or entry
- Total insured value summed as you go
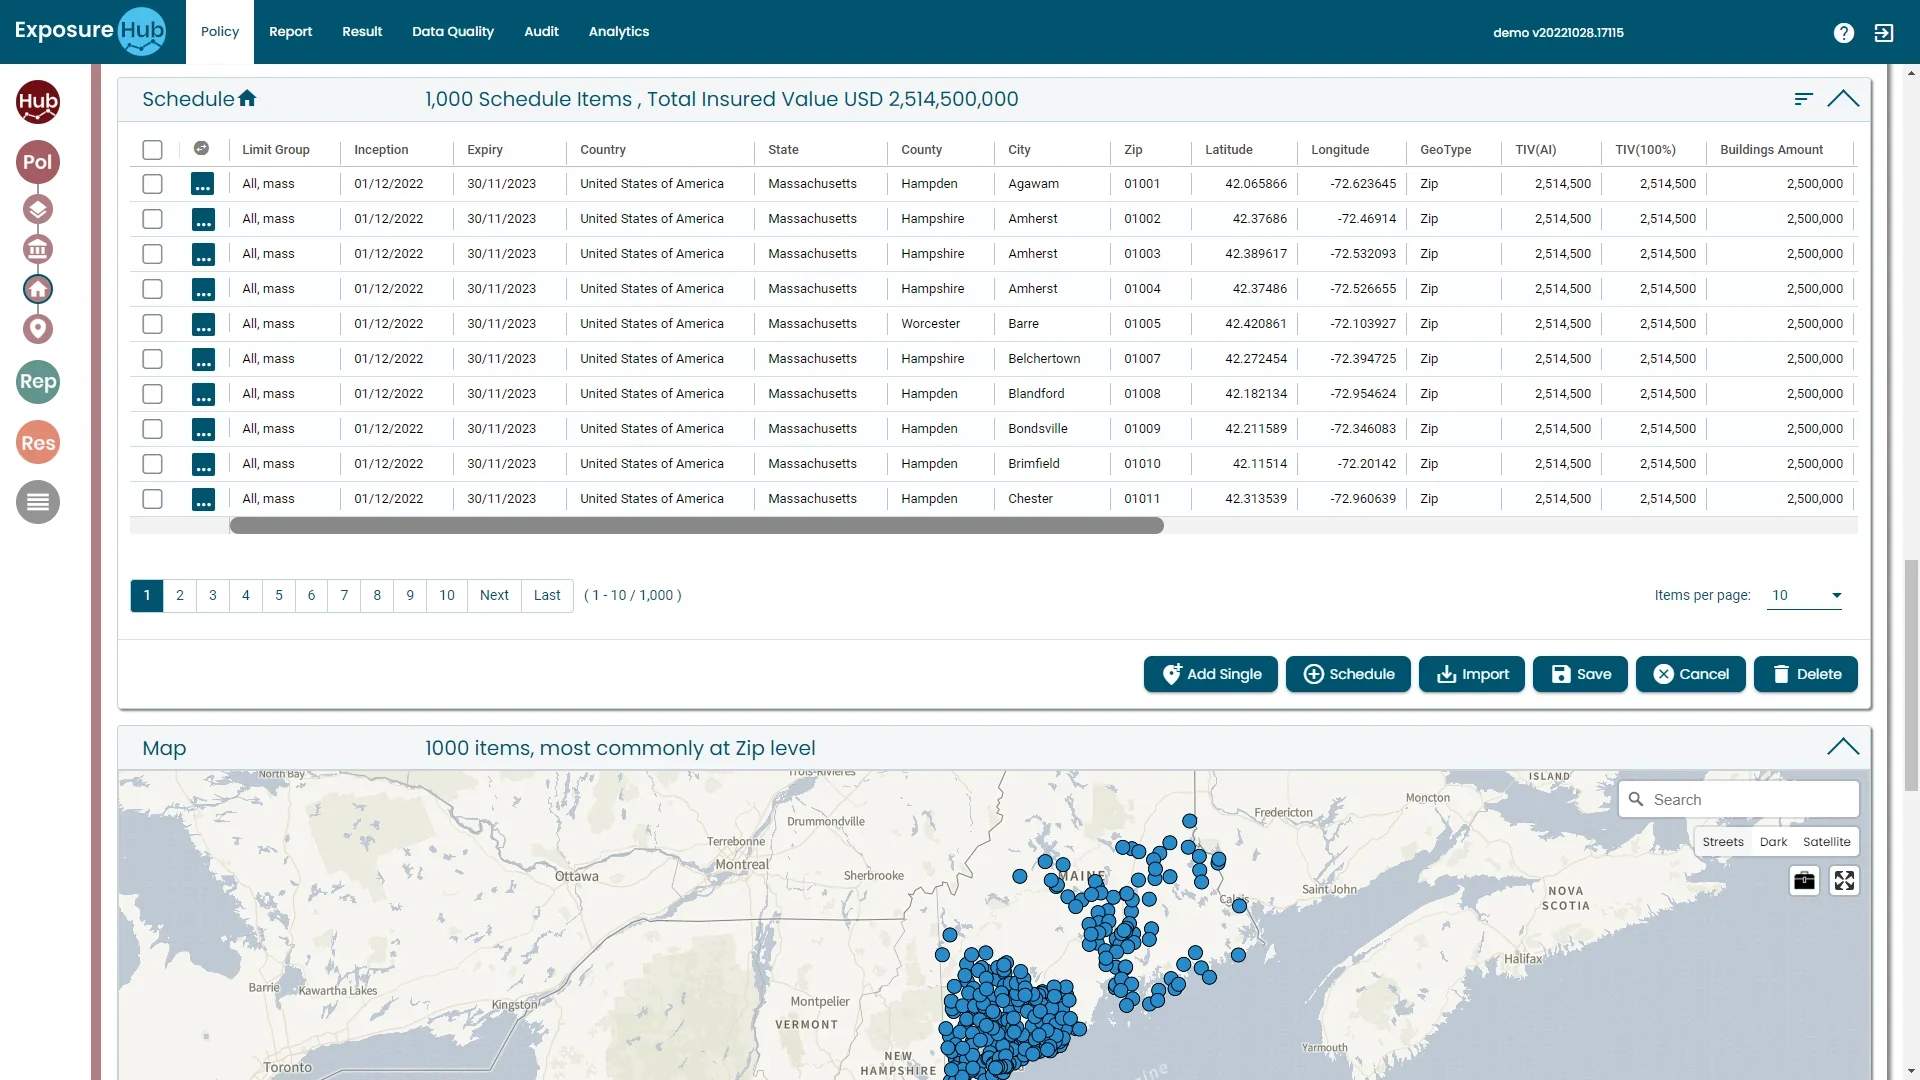
ExposureHUB demo environment · sample data
Four cuts of the same schedule, and each finds something different.
Total insured value by zone
Values summed by postal area, flood zone, quake zone or distance to coast, then read against the appetite for each. CRESTA-style zones are how many markets name the same idea.
TIV in USD m · white tick is the appetite · illustrative, fictional values
Where accumulation is a standing conversation.
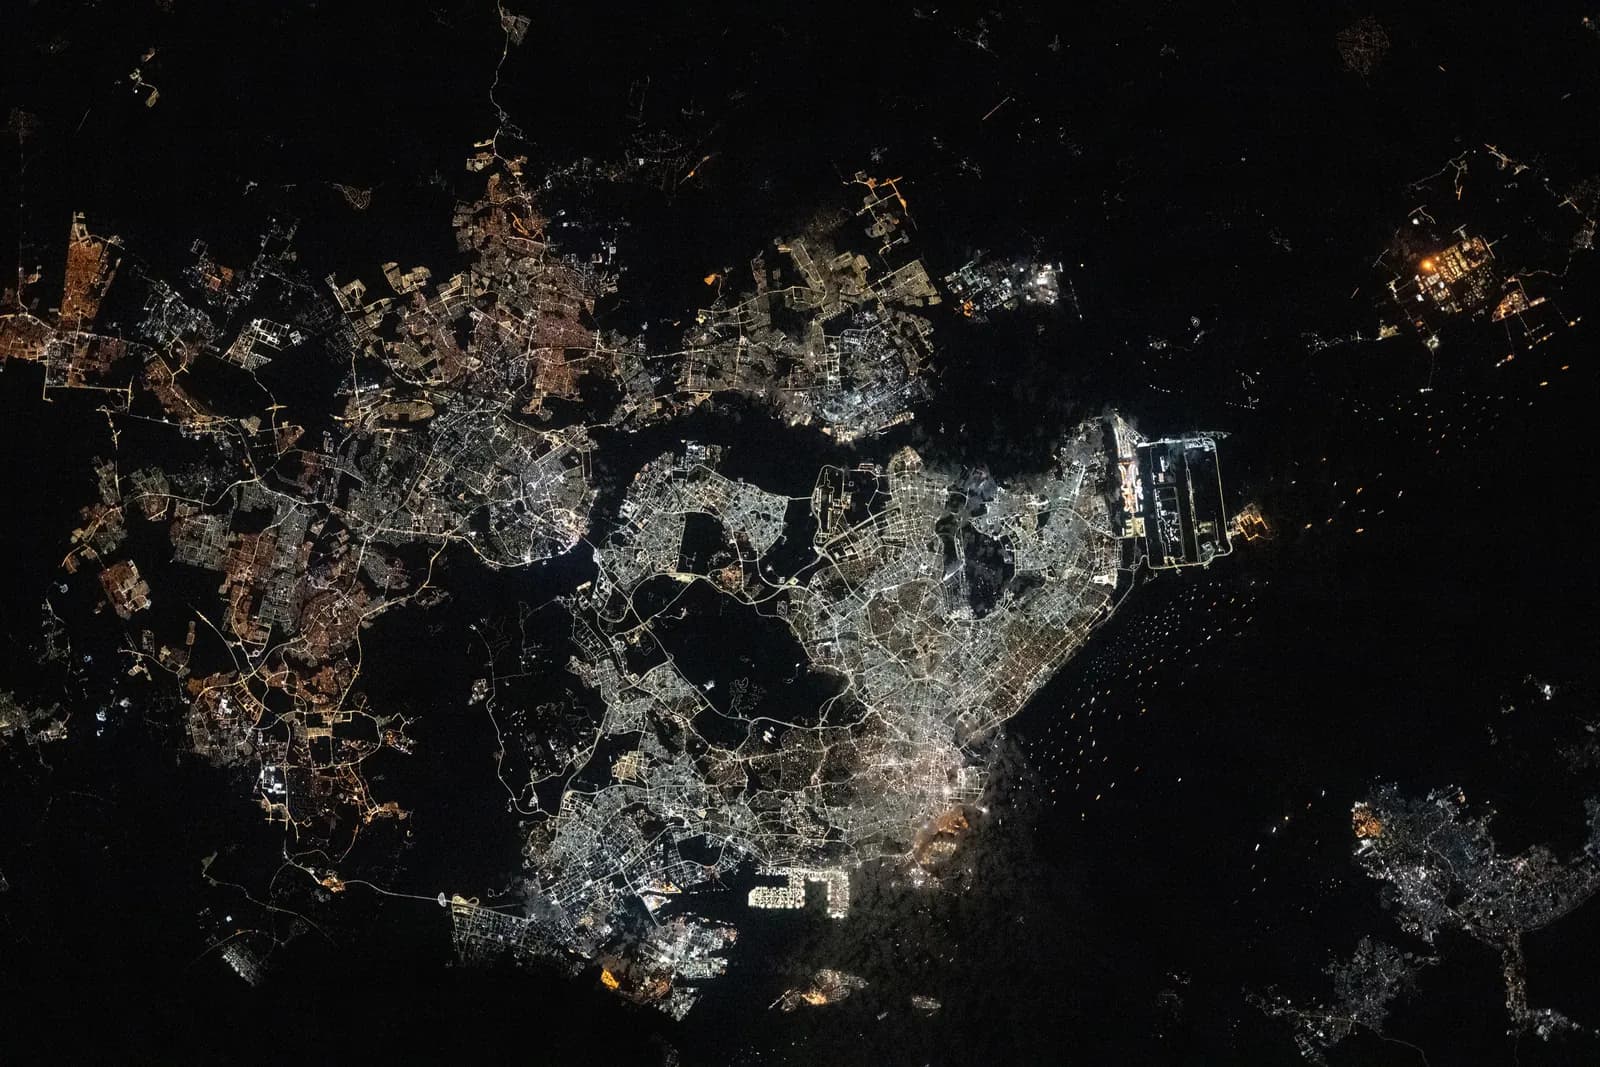
US Gulf and Southeast wind, Californian quake and wildfire, Japanese quake, North-West European flood and windstorm, South-East Asian typhoon, eastern Australian flood and cyclone. The geography is real; the shading marks where the conversation sits, not anyone's exposure.
Property is the pattern the other classes follow. A fast-growing specialty MGA started its rollout with Property D&F and used it as the repeatable template for its other classes.
Ask the book what is inside the ring.
The questions a team asks of this book, and what in the platform answers each.
The four perils every property book answers to.
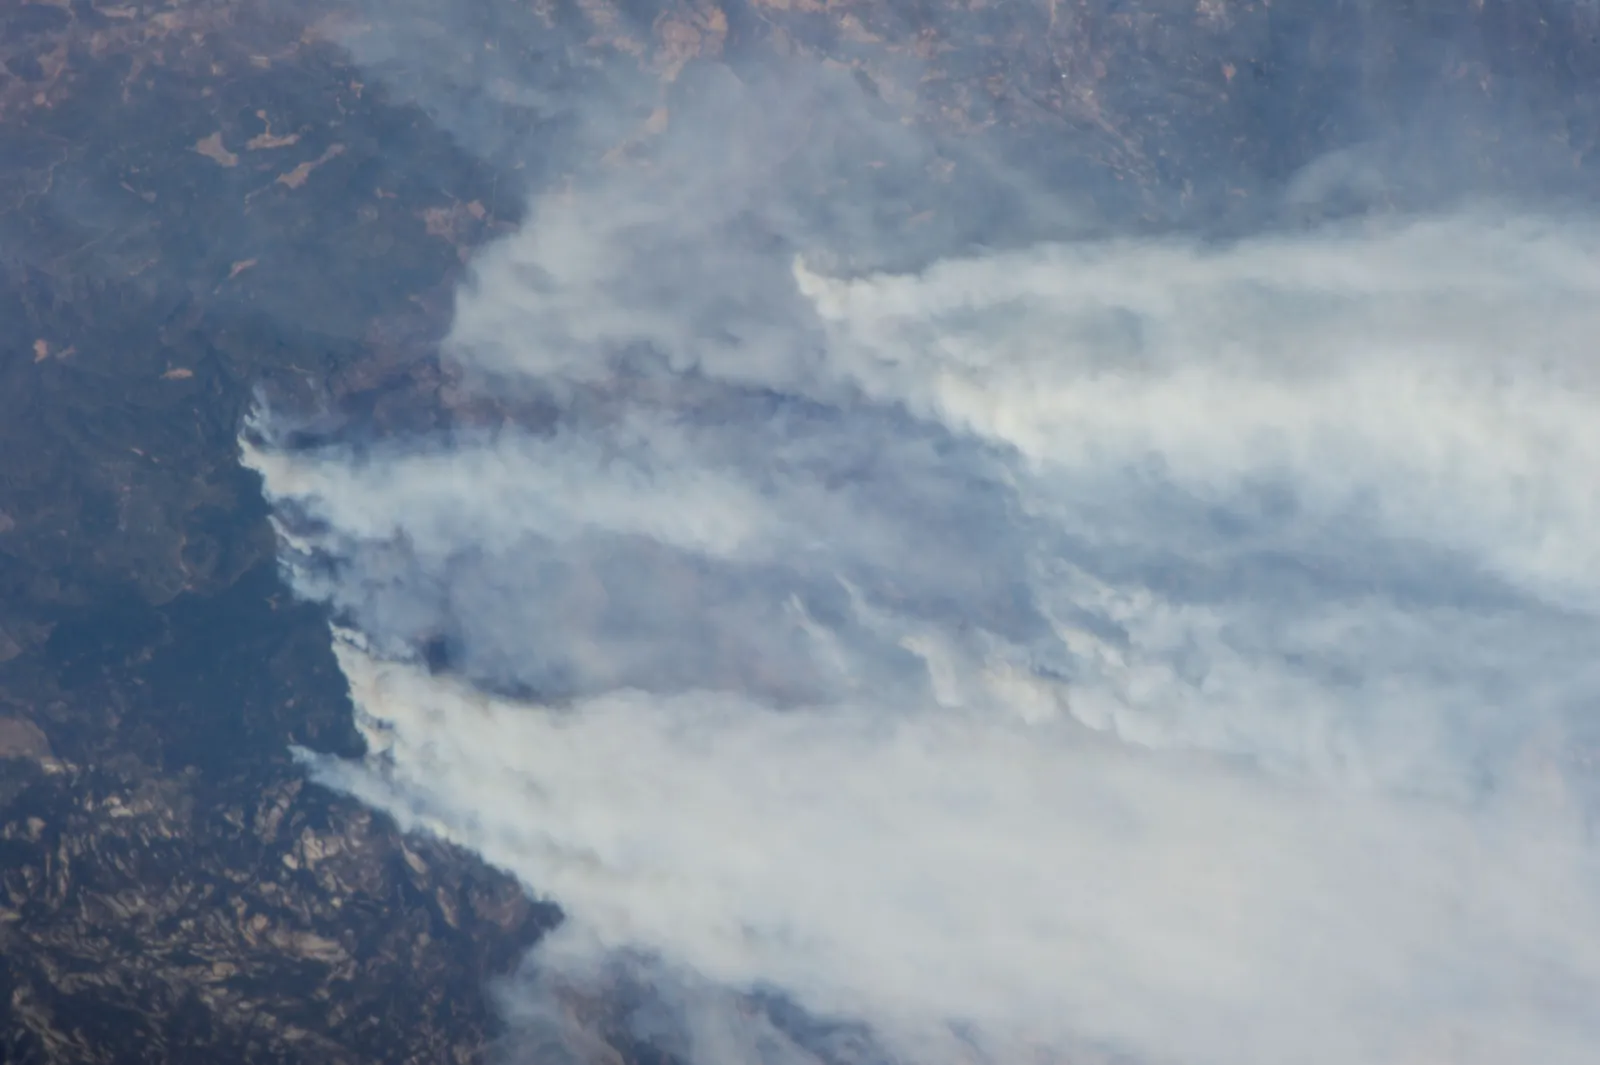
Hurricane, typhoon and windstorm tracks cross hundreds of locations in a day. Damage falls with distance from the track, which is why the Result key is banded.
A swath over the schedule, locations sorted into the 25%, 10% and 5% bands of the demo key.
A customer started with Property D&F.
A fast-growing specialty MGA writing on behalf of other carriers owes each of them reporting. It needed that reporting automated, not a manual data exercise that would ordinarily have taken weeks.
the template every other class reused
“ExposureHub has become the cornerstone of our Catastrophe risk management strategy.”
Managing Director
Specialty MGA customer
How the rollout runs: one class first, then the template.
- Location schedules loaded from files or connected systems
- Records validated, then geocoded
- Zone and peril accumulation, with the first scenarios
- Each further property team is brought on with the same template
- Workshops with each team to agree what it needs
- Direct and facultative on the same template
- Event footprints for the main perils
- Reporting to carriers in configured formats
- Casualty, specialty and other classes on the same pattern
- Third-party model and data feeds
From an Ebix Europe customer story. The three groupings (go-live, three months after, longer term) and the one-class-first approach are the customer's; what sits in each column for property shows how a rollout would be scoped.
Modules involved, and the classes beside it.

See Property on ExposureHUB.
Book a walk-through built around your property schedule and the questions your team asks of it.