Offshore, onshore and everything in between
Energy risk is concentrated and remote: platforms in a single basin, a refinery complex on one coast, a wind farm across a ridge.
The Energy Module is built for it, with geocoding for offshore and onshore facilities and energy-specific data formats and scenarios.
- Upstream, downstream and power generation
- Offshore and onshore facilities geocoded
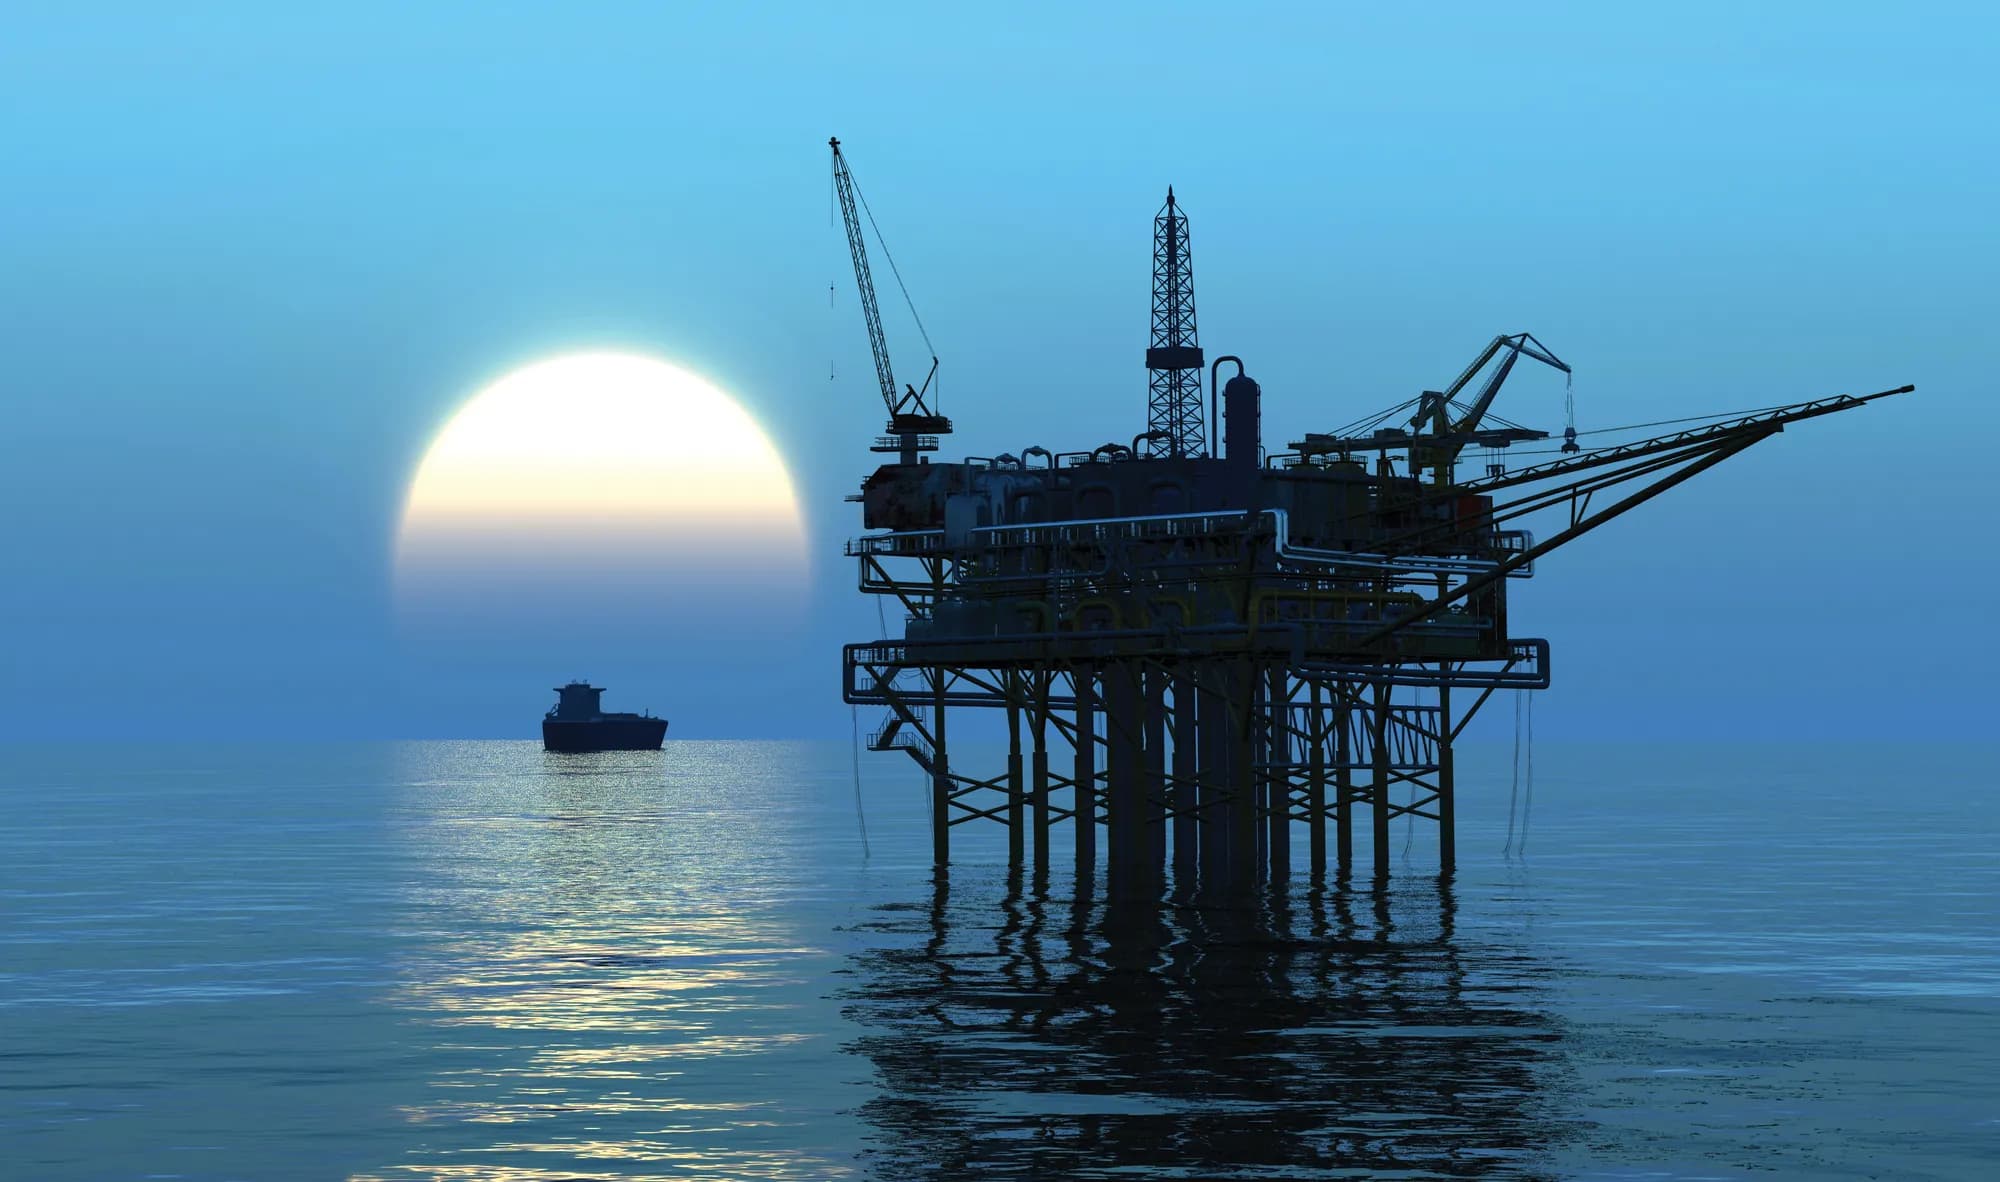

across the basin, the refinery coast and the power plants.
An offshore platform has no street address. So where is it when the storm arrives?
A platform is a very large value in a very small place, on a schedule that rarely looks like a property schedule. A refinery is the same on land: tank farms, process units and a jetty behind one fence.
Exposure management for energy starts with putting those assets where they really are, and splitting the book by where they sit in the chain.
Offshore platforms and rigs, many in one basin.
Refineries and petrochemical complexes on one coastline.
Thermal, hydro and renewables, wind farms under one weather system.
The platform photo, in three moves.
Place the asset
Asset location geocoding for offshore and onshore facilities. A platform is a point in open water, held as coordinates rather than an address, so it can sit on the same map as a refinery.
Asset location geocoding for offshore and onshore facilities
From the Energy Module.
A mature, production-ready module, purpose built for energy.
Available for immediate deployment for clients writing upstream, downstream or power generation risk.
Wording from the ExposureHub page on ebixrisk.com
Pre-built data formats for asset classes
Start from formats designed for energy assets.
Upstream and downstream risk segmentation
Asset location geocoding for offshore and onshore facilities
Loss scenario modelling for energy-specific perils
Ready to deploy without configuration from scratch
Open water or a fenced coastline: it has to be somewhere exact.
Offshore: a point in open water
Platforms and rigs have no address and many sit in one basin under one weather system. They are placed by coordinates, so a basin total and a storm footprint can be read on the same map.
Onshore: a site on a coast
Refineries, terminals and power plants are large, fenced and often on the shore. They are placed at the site, so the question of which downstream assets share a coastline and a storm track has an answer.
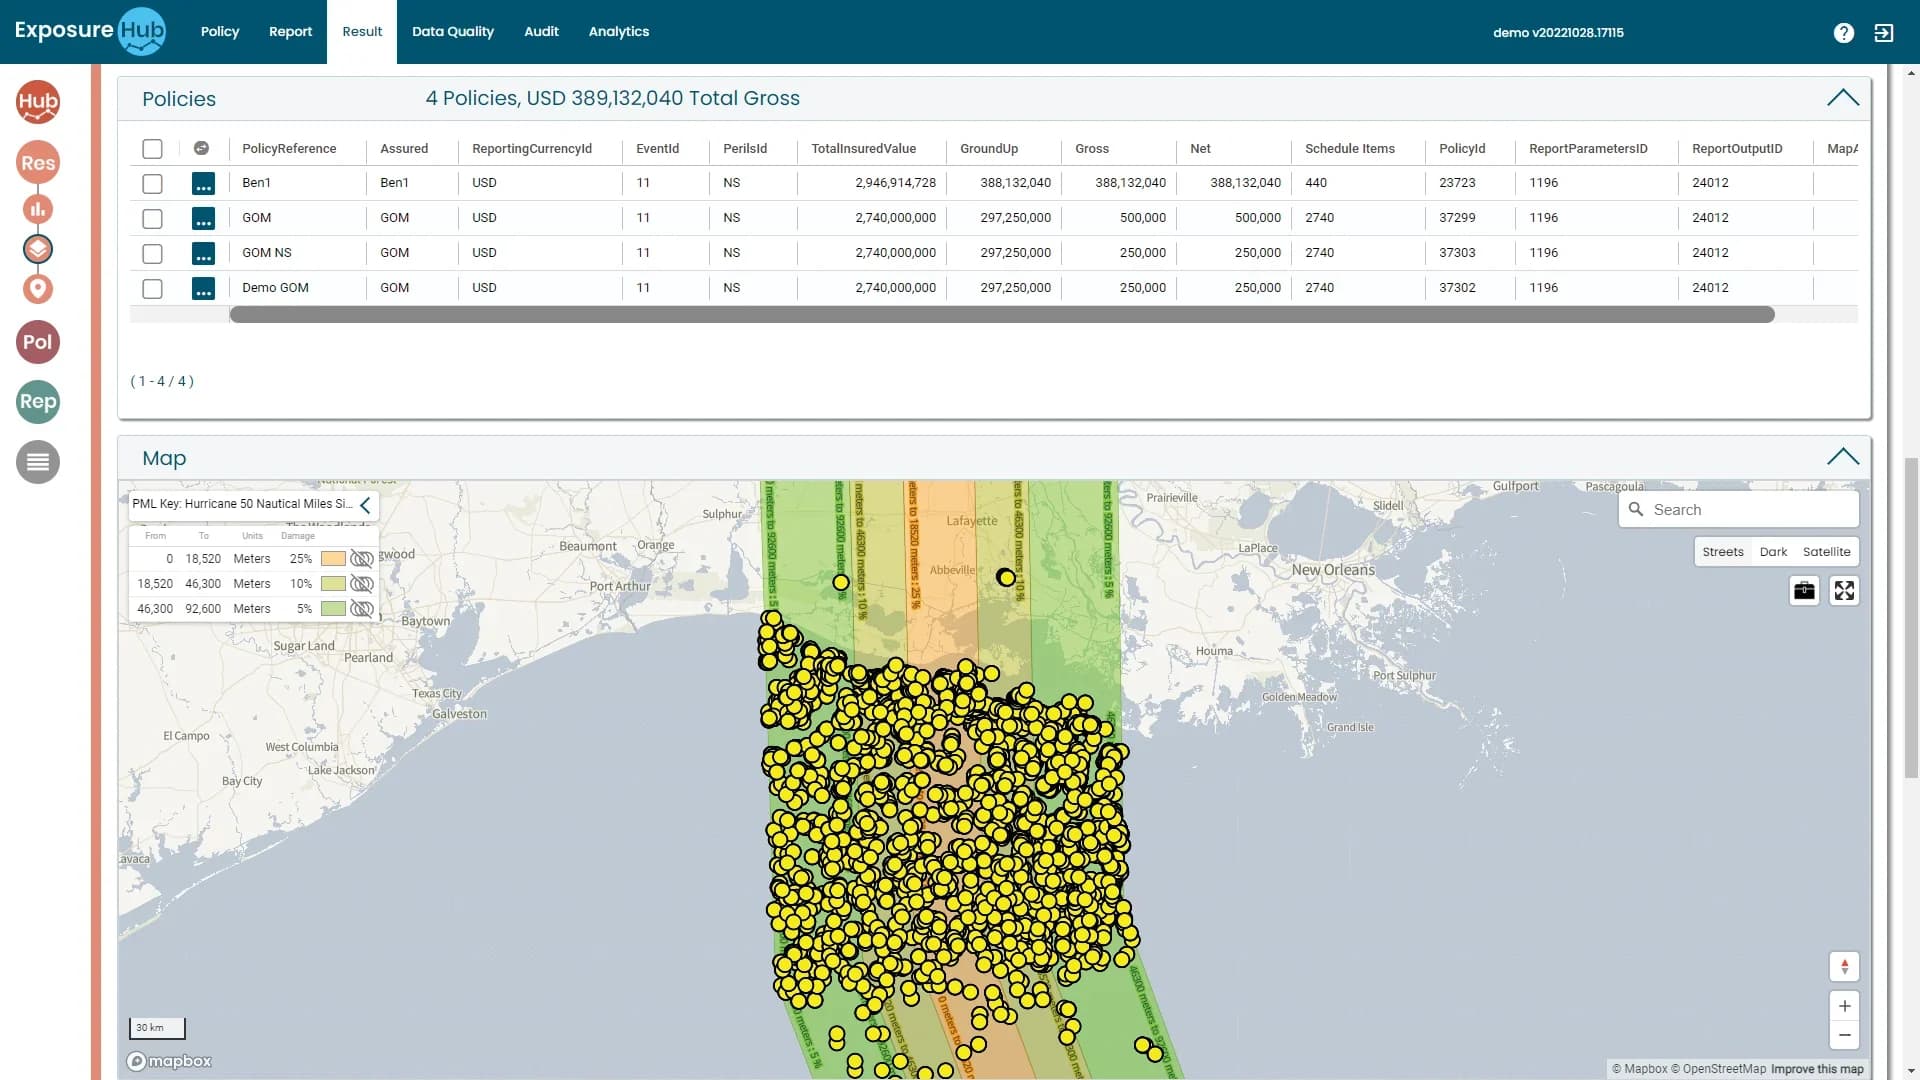
The Gulf of Mexico, on the real result screen.
Ground-up, gross and net
The Result tab lists each policy's ground-up, gross and net, with the schedule items behind it: the numbers an underwriter or a carrier asks for.
ExposureHUB demo environment · sample data
Ask the book where the assets are.
The questions a team asks of this book, and what in the platform answers each.
Weather, ground and the scenarios built for energy.
One storm crossing a basin reaches every platform in it, then the refineries on the coast where it lands. Offshore and onshore are a single event.
A track over offshore and onshore points together, with upstream and downstream split.
Surge and river flood reach coastal refineries, terminals and low-lying plants. Offshore, the hazard is the sea, not water on land.
Coastal and flood-zone sites by value; offshore assets by basin.
Onshore plants and pipelines cross the same faults, and one shock reaches a refinery, its tank farm and the power that feeds it.
Site values by quake zone, with pipelines and infrastructure as a layer.
The Energy Module lists loss scenario modelling for energy-specific perils, run over the geocoded energy book.
Scenario outputs by segment: upstream, downstream and power generation.
How the rollout runs: one class first, then the template.
- Energy asset schedules loaded in energy-specific formats
- Offshore and onshore facilities geocoded
- Upstream, downstream and power generation split out
- Each further energy team is brought on with the same template
- Workshops with each team to agree what it needs
- Loss scenarios for energy-specific perils over the book
- Reporting to carriers and capacity providers
- Energy beside property and marine in one cross-class view
- Third-party model and data feeds
From an Ebix Europe customer story. The three groupings (go-live, three months after, longer term) and the one-class-first approach are the customer's; what sits in each column for energy shows how a rollout would be scoped.
Modules involved, and the classes beside it.
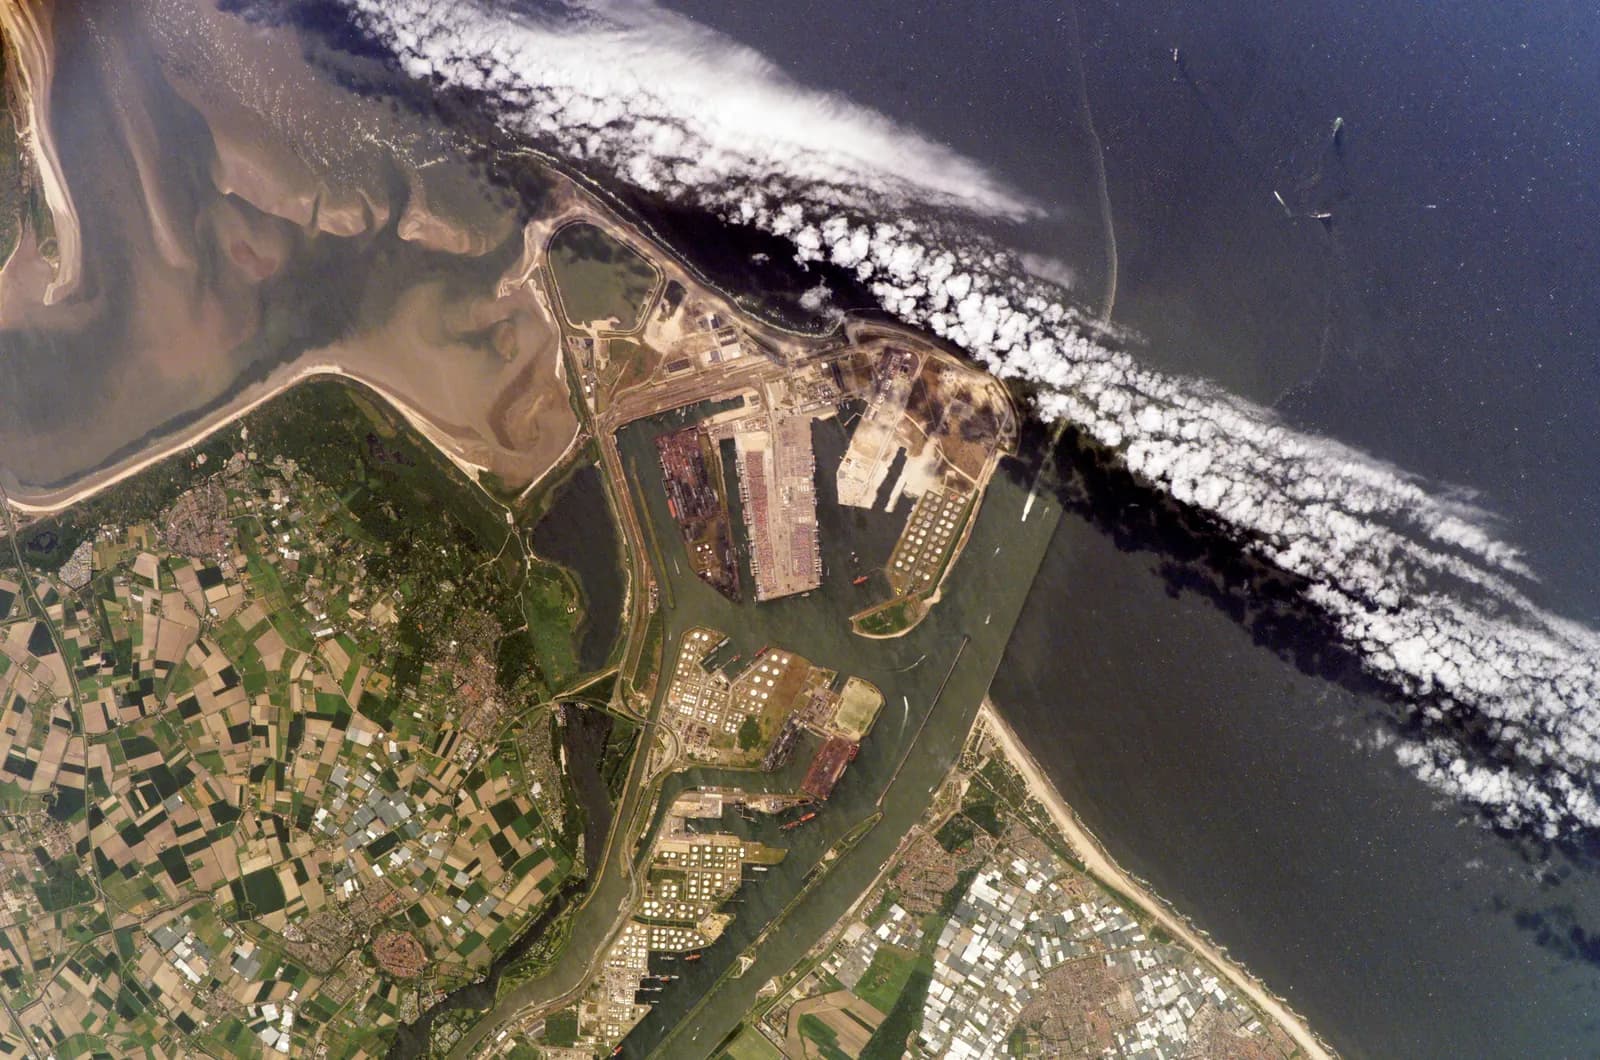
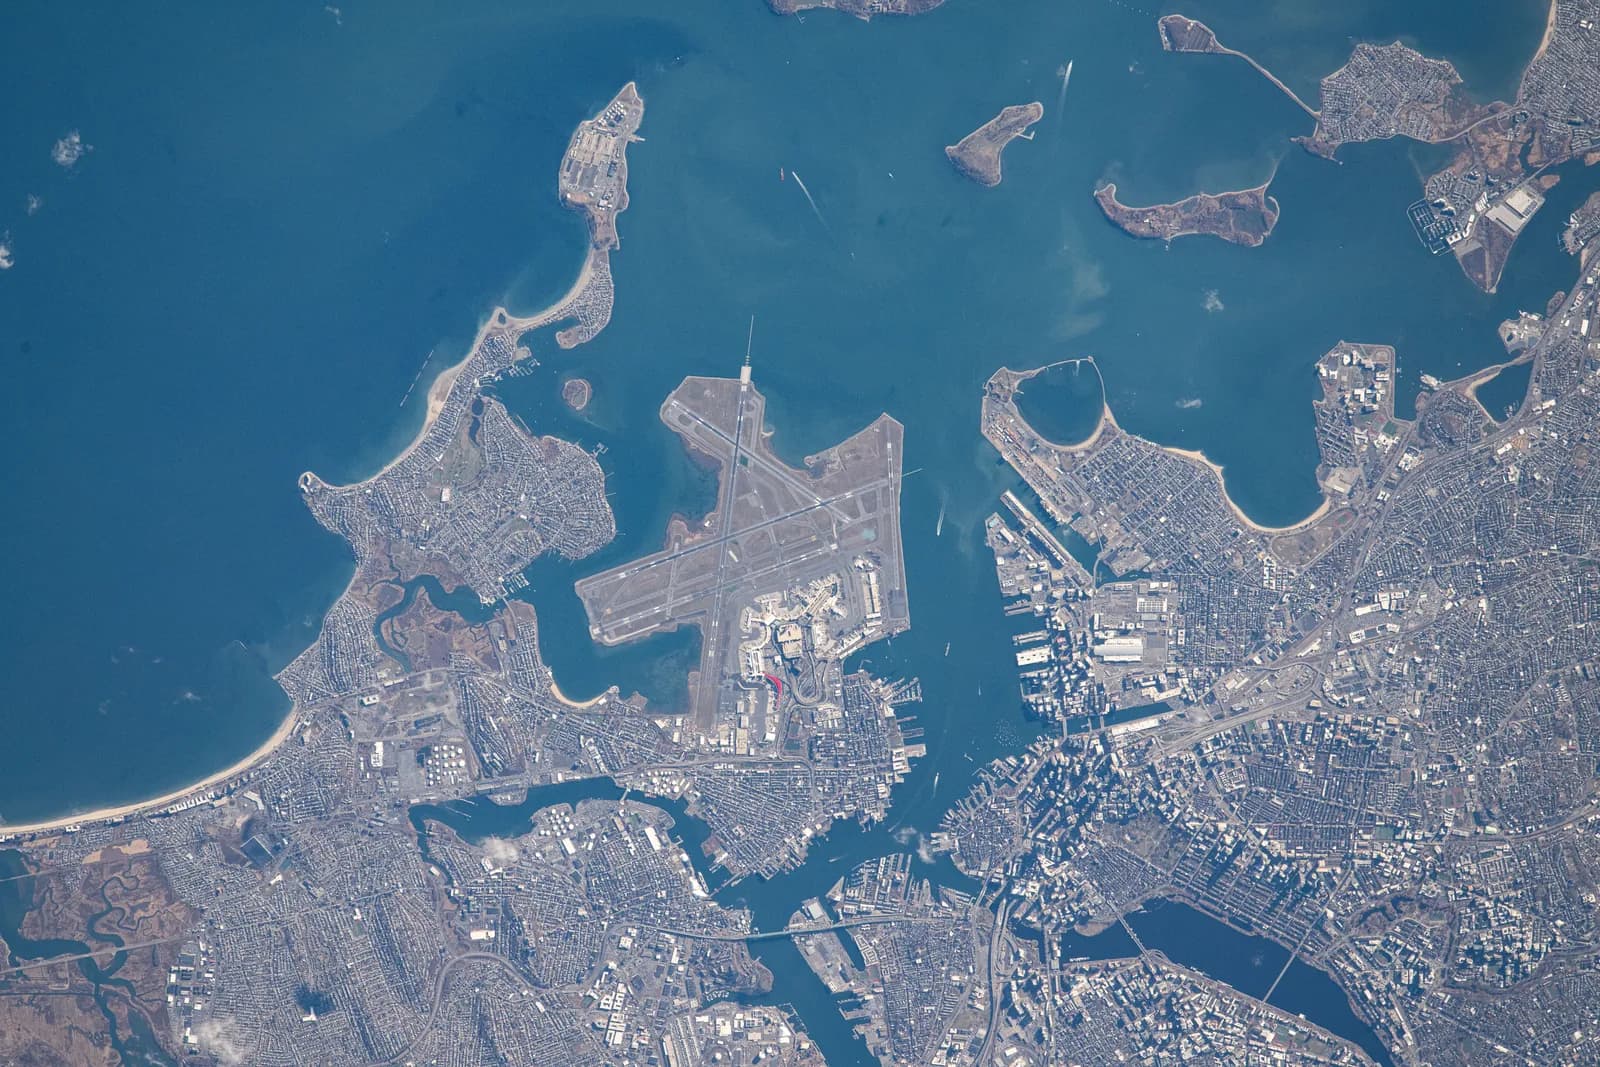
See Energy on ExposureHUB.
Book a walk-through built around your energy schedule and the questions your team asks of it.