Exposure is not only buildings and weather
Casualty exposure is measured in limits rather than values, and it concentrates around people and companies as much as places: a financial centre, a large employer, one event touching many policies.
The work is seeing where limits stack up and where one event could trigger many of them.
Limits stack up around people, not only places.
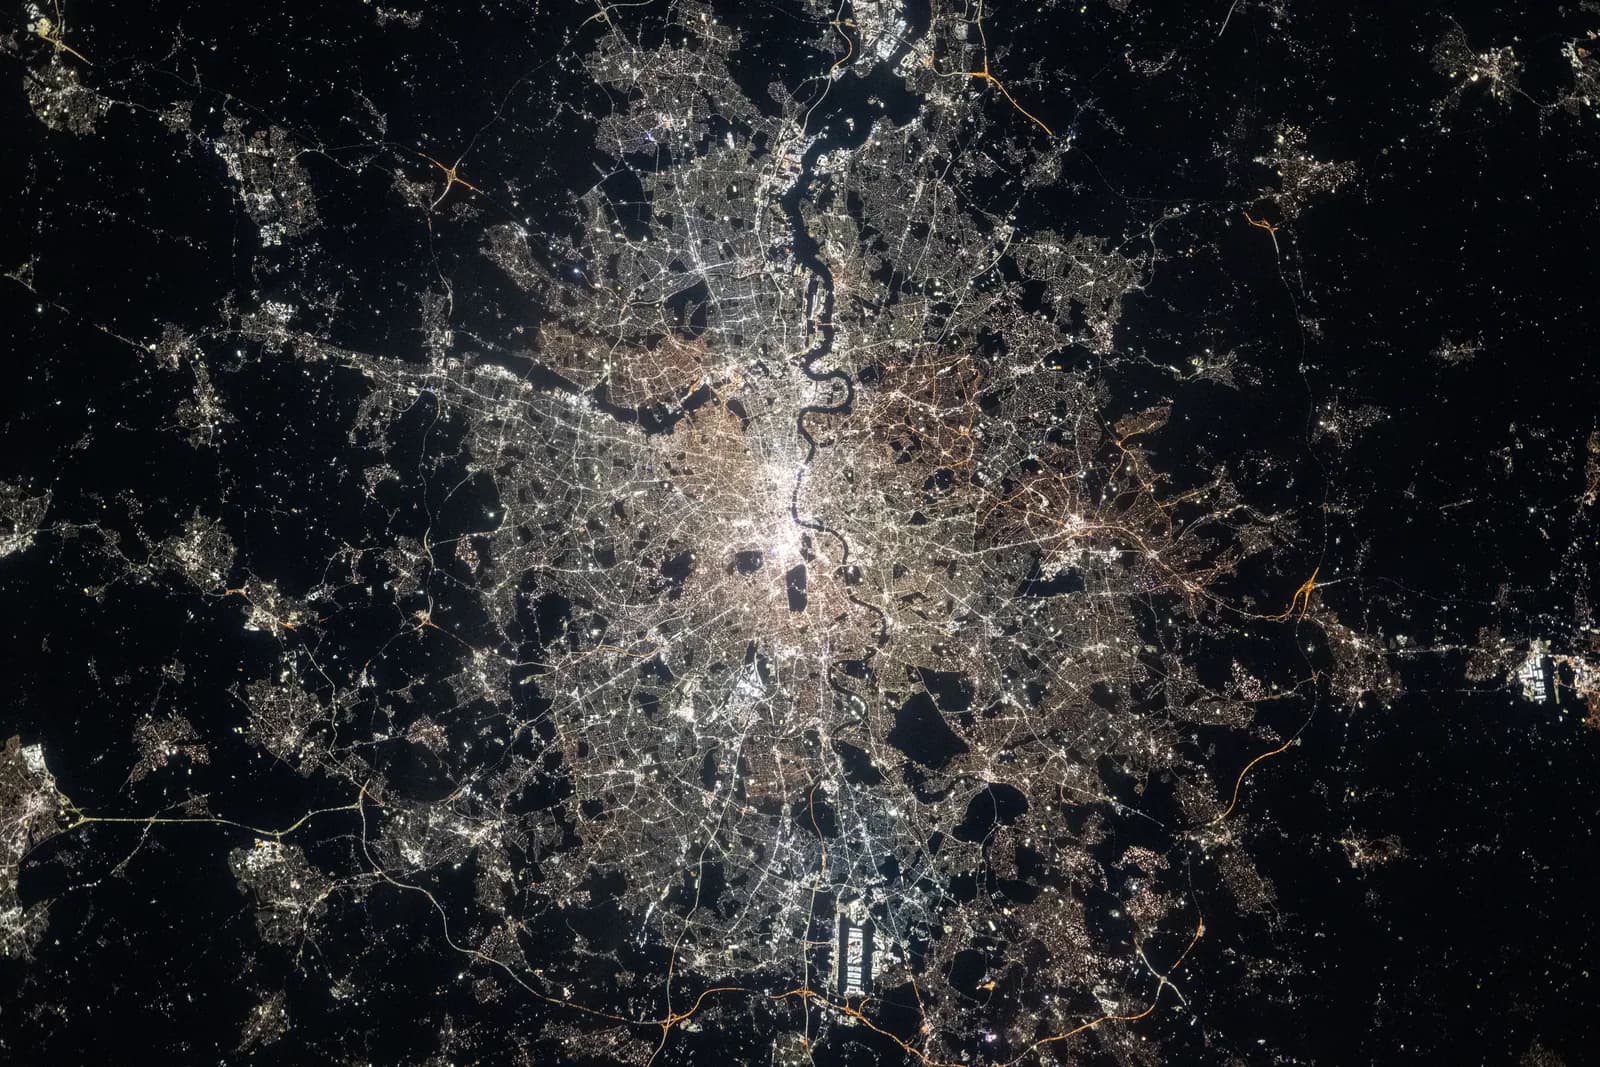
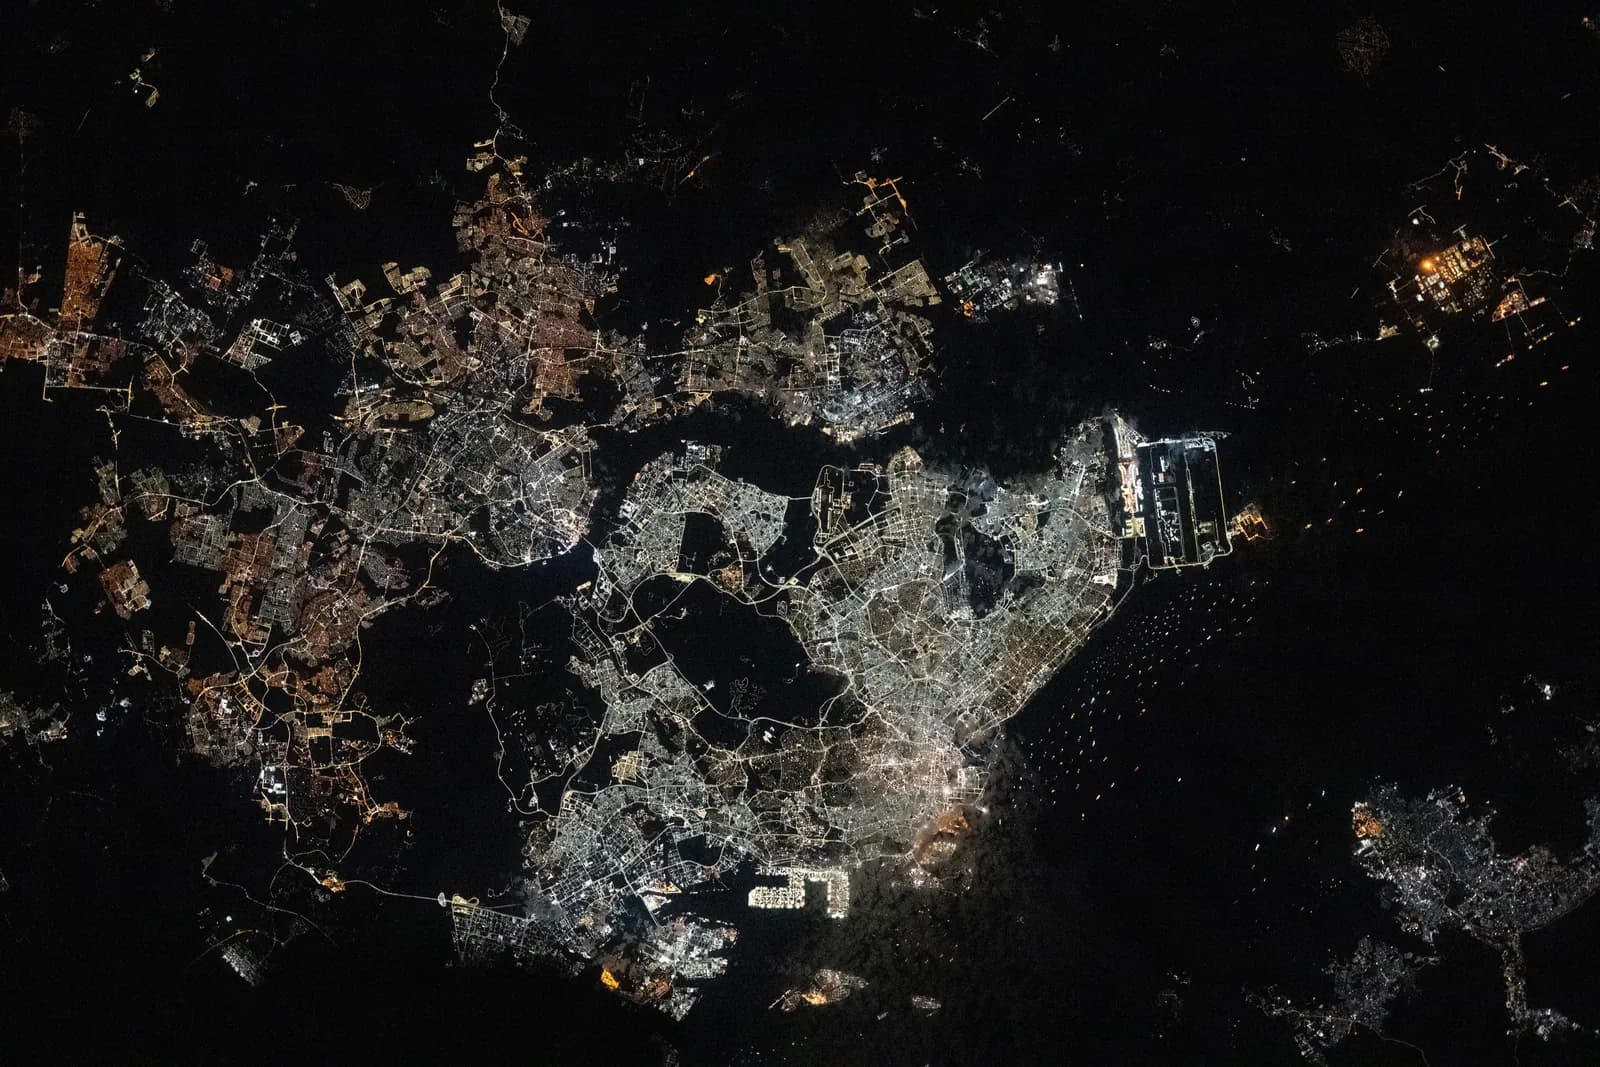 Photo: NASA

of limits inside one event ring, across three classes.
A fire closes a tower in a financial centre. Which policies name the people who work in it?
The property loss is one conversation. The casualty one is wider, written on different days, by different underwriters, in different classes.
A limit is not an address. To see the clash you link the insureds to a place and to each other, then add up the limits that one event could reach.
General liability on the building.
Professional liability of each tenant.
Workers' compensation for the people on the floors.
Add up the towers: stack, centre, clash.
One insured, three limits
Casualty is measured in limits. One employer carries general liability, professional liability and workers' compensation, each written separately. Stacked, they are the real line on that name.
Your share of a large programme, against your appetite.
A casualty programme is a tower of layers. Writing a slice of the primary and a slice of the excess puts two lines on the same insured, and the same event can reach both. Read it layer by layer, then against the share you are willing to hold on one name.
The platform handles multiple lines of business. Casualty schedules map in through ConfigHub, and the Insight module aggregates limits by insured, place and scenario.
Public Ebix material names a dedicated module only for Energy. For casualty, the platform is the same configurable, multi-line one, set up with your own schedules.
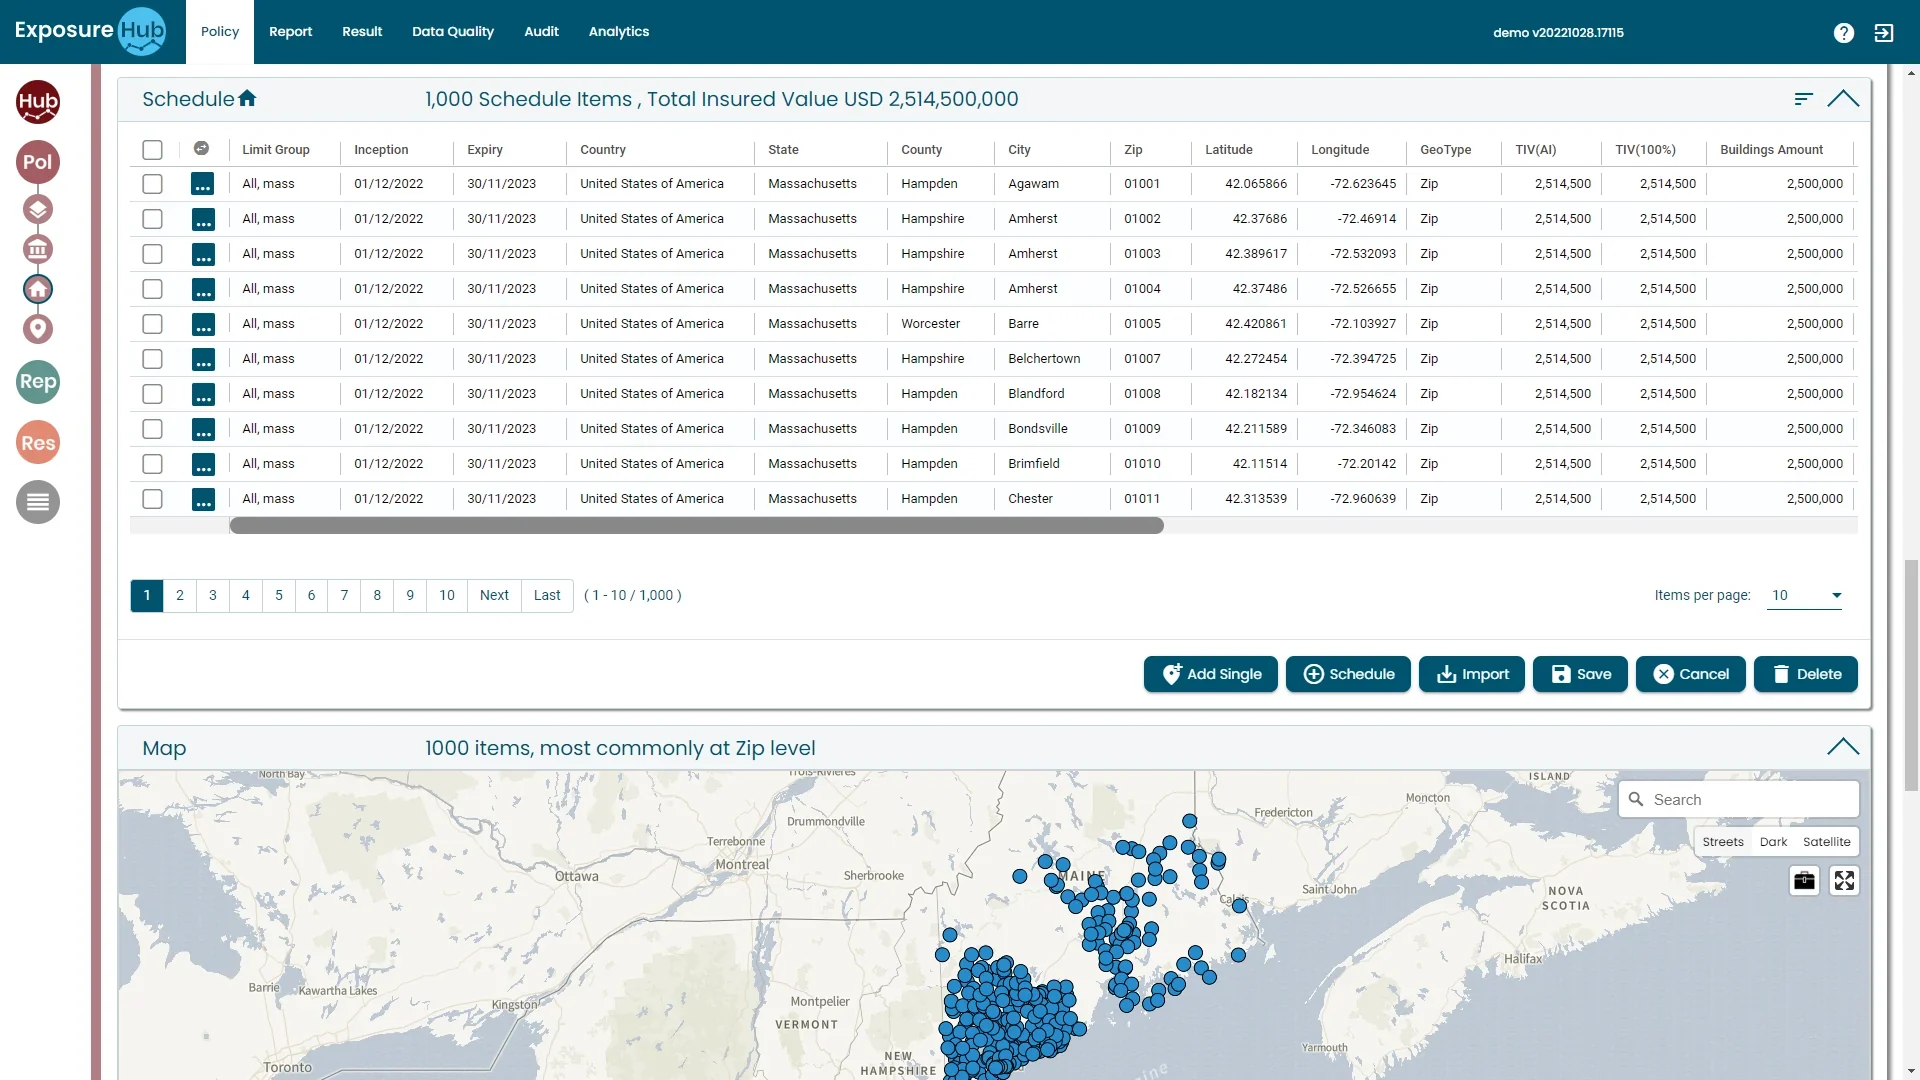
Limits are a field on the schedule, and a city is a point on the map.
ExposureHUB demo environment · Policy tab · demo property schedule
Ask the book whose limits are in the room.
What are our total limits for this insured across classes?
Limits aggregated by insured, whichever line they were written on.
Which clients sit in the same building or campus?
Where could one event trigger several of our policies?
What is our largest casualty concentration by city?
Events that reach more than one policy.
One incident reaches liability, professional and workers' compensation at once. Each policy is unremarkable alone; together they are the loss.
A scenario ring, with limits summed by class inside it.
How the rollout runs: one class first, then the template.
- Policies, limits and insureds loaded and mapped through ConfigHub
- Insureds linked to their locations
- Limits aggregated by insured and by city
- Each further casualty team is brought on with the same template
- Workshops with each team to agree what it needs
- Clash and concentration scenarios
- Programme and layer views
- Exports for carriers and capacity providers
- Casualty beside property and specialty in one cross-class view
- Third-party model and data feeds
From an Ebix Europe customer story. The three groupings (go-live, three months after, longer term) and the one-class-first approach are the customer's; what sits in each column for casualty shows how a rollout would be scoped.
Modules involved, and the classes beside it.

See Casualty on ExposureHUB.
Book a walk-through built around your casualty schedule and the questions your team asks of it.