Giving you power over your exposure data
A modular, fully configurable exposure management platform for insurers, reinsurers, MGAs, brokers and risk teams: your schedules on one map, every accumulation in view, any catastrophe drawn over the portfolio.
- Data in by file, integration or entry, checked against your rules
- Geocoded, aggregated, run through simulated catastrophe and non-catastrophe scenarios, and reported
- You are in control
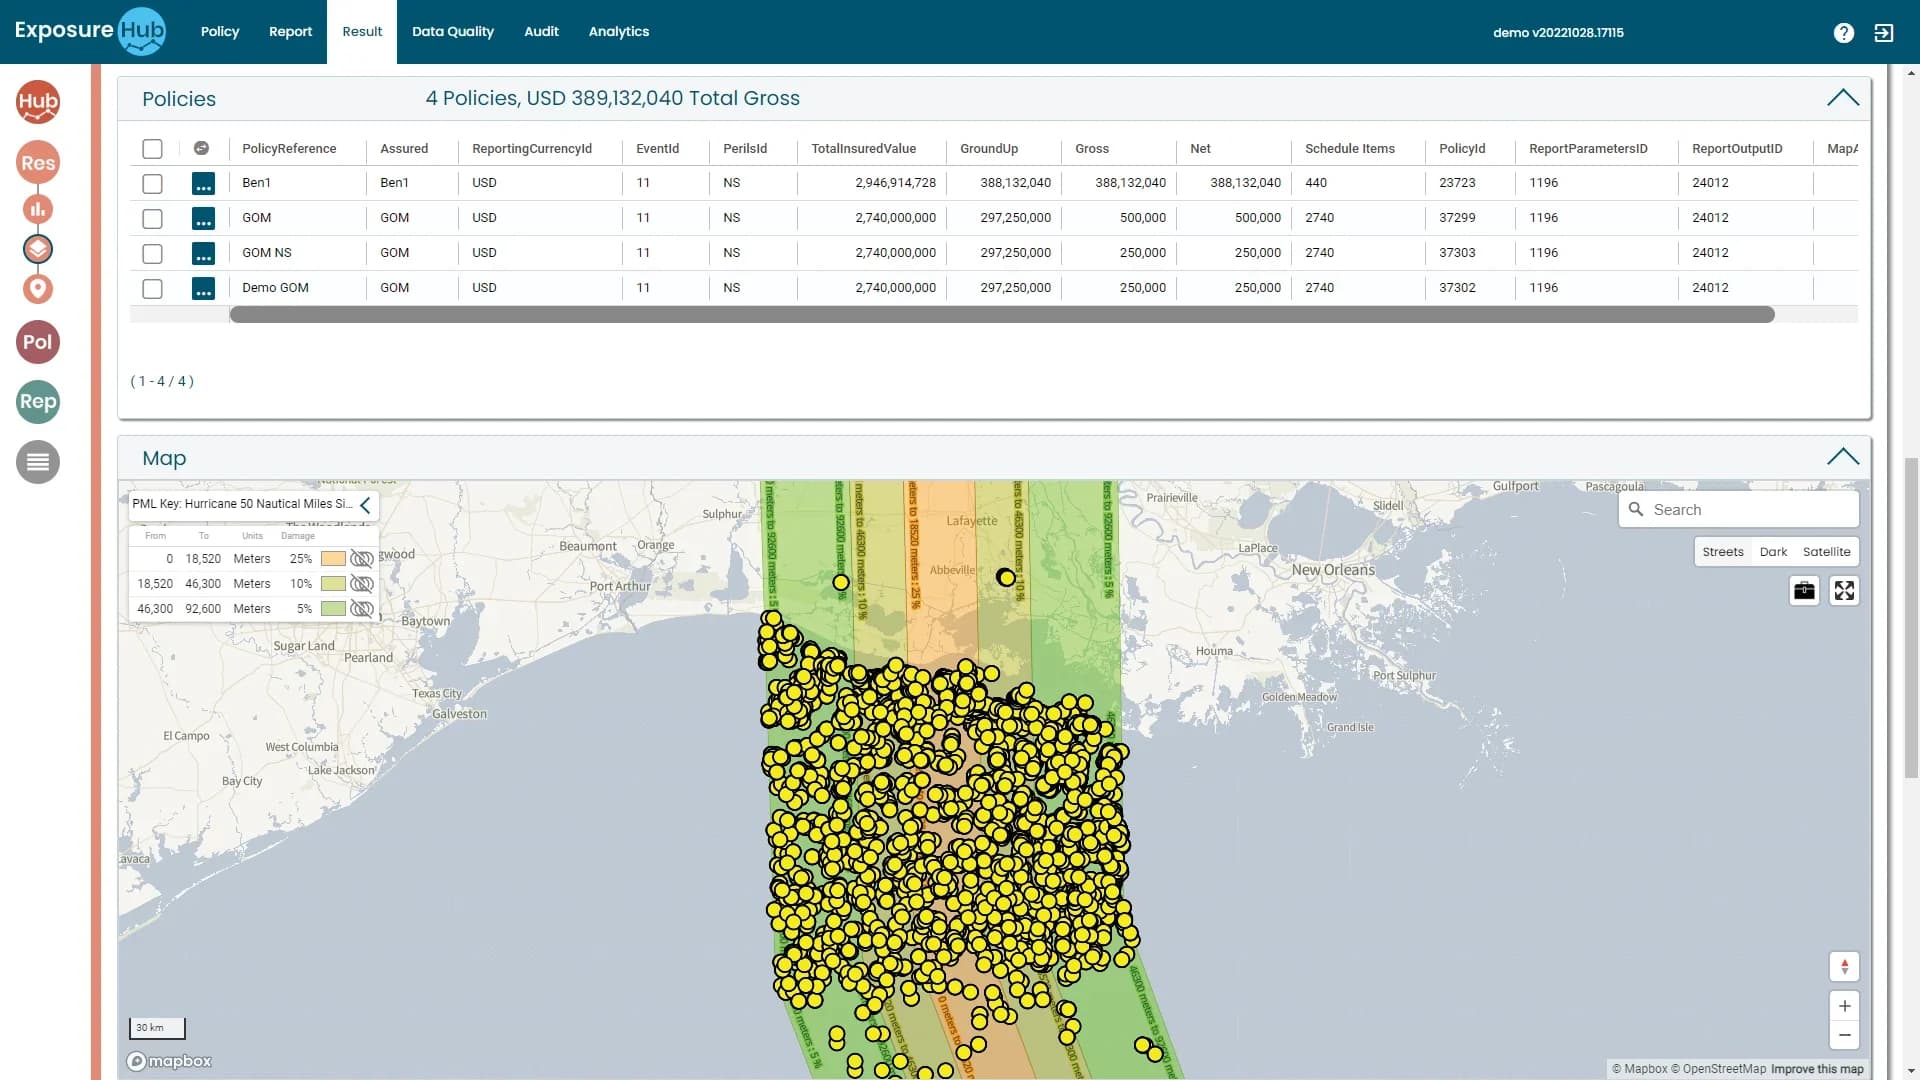
Total gross in the event · 4 policies
USD 389,132,040
ExposureHub Result tab · demo environment, sample data
From scattered schedules to one live view.
ExposureHub consolidates portfolio data, applies geocoding and surfaces accumulations in near real time, so your team spends its time on decisions, not data preparation.
Before
Manual and messy

With ExposureHub
Checked, mapped, live
- Schedules arrive by file, API or entry, and are checked against your rules
- Every location geocoded and on one map
- Accumulations by zone, peril and client
- Reports in each carrier's own format
- Exporting to industry standard formats that include Verisk Touchstone and Moody's RMS
One workflow, on the real screens.
Policy, Report and Result: from a schedule of locations to the answer for a named event.
Start with the schedule, on the map.
Load locations by import file, integration or entry. Every row is geocoded and placed on the map below it.
- Import, add single, schedule
- Latitude, longitude and geotype per location
- Total insured value summed as you go
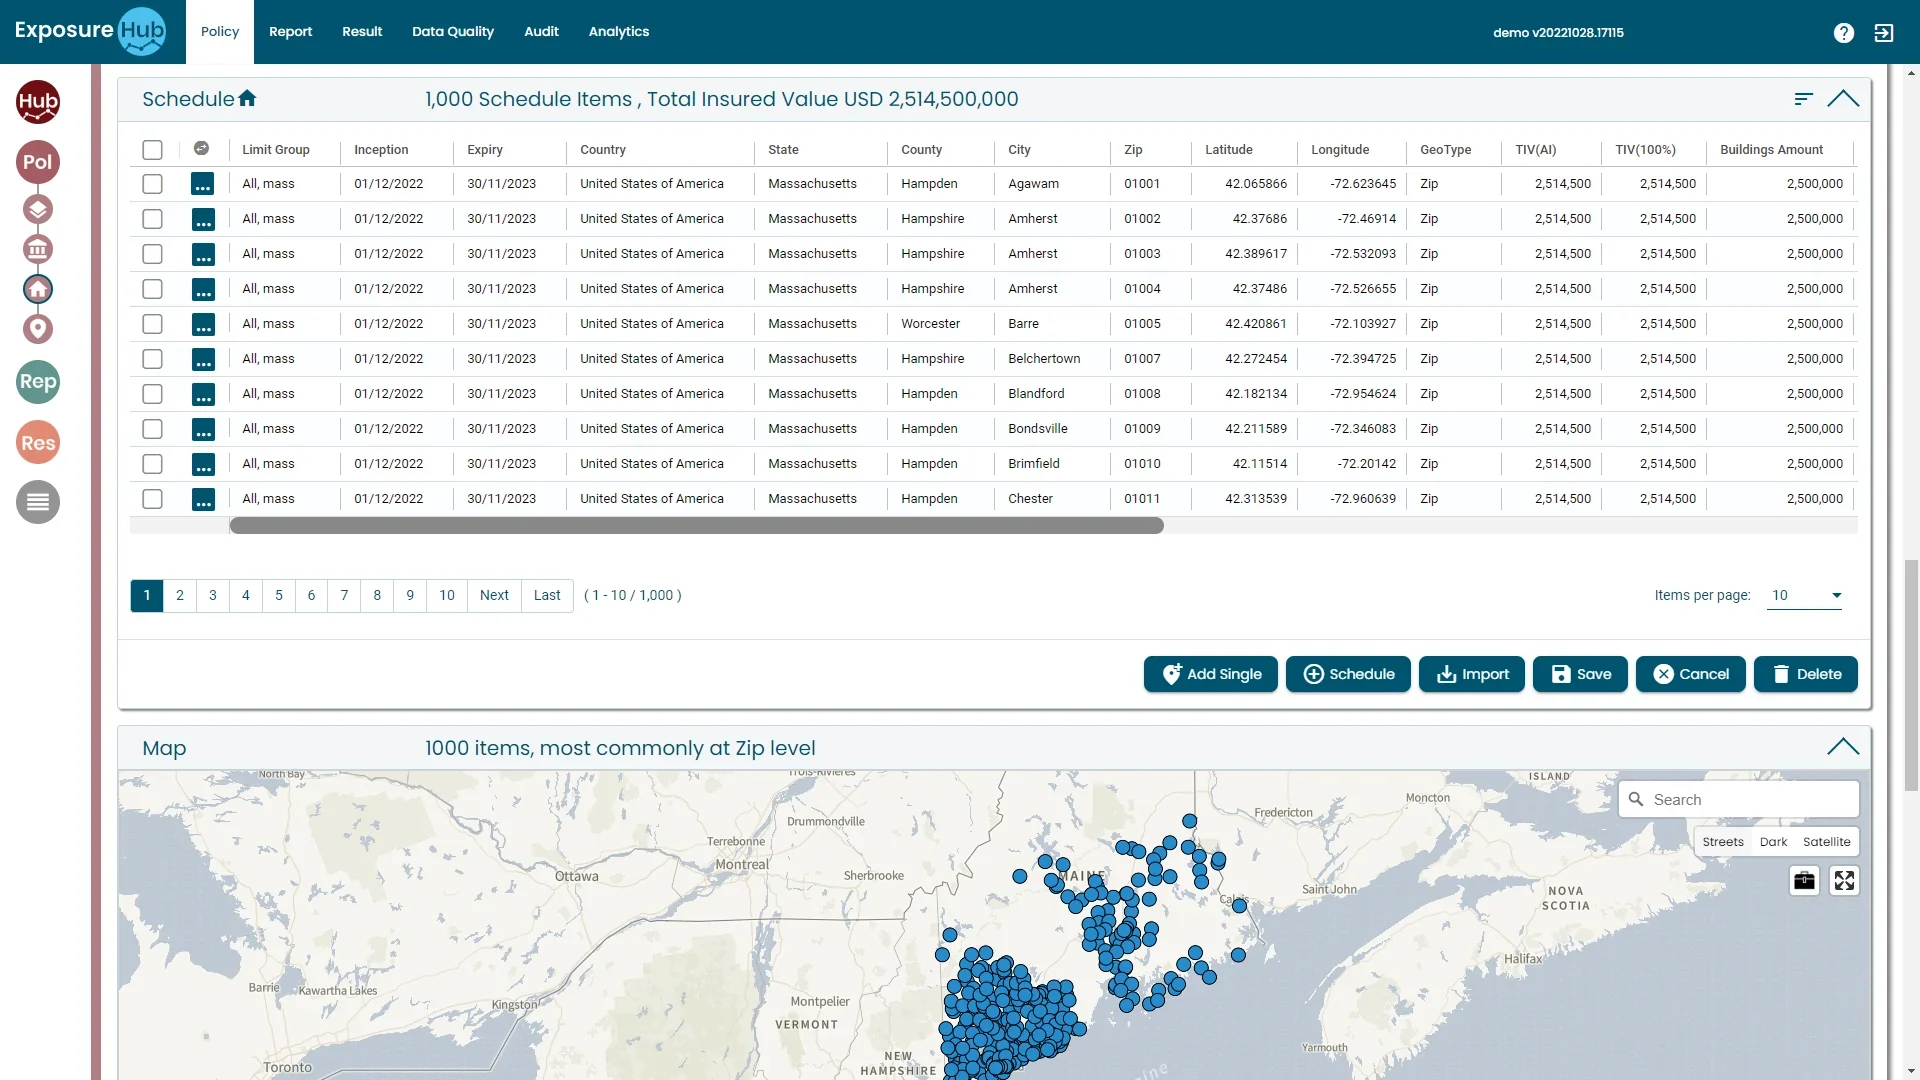
ExposureHub demo environment · sample data
Draw the event over the book.
Choose the class, the peril and the coverages, set the as-at date, and draw the event: hotspot shapes, offsets and damage factor sets. The rings are the damage bands.
- Shape and storm tools
- Offsets and damage factor sets
- Policies and schedules in scope, counted for you
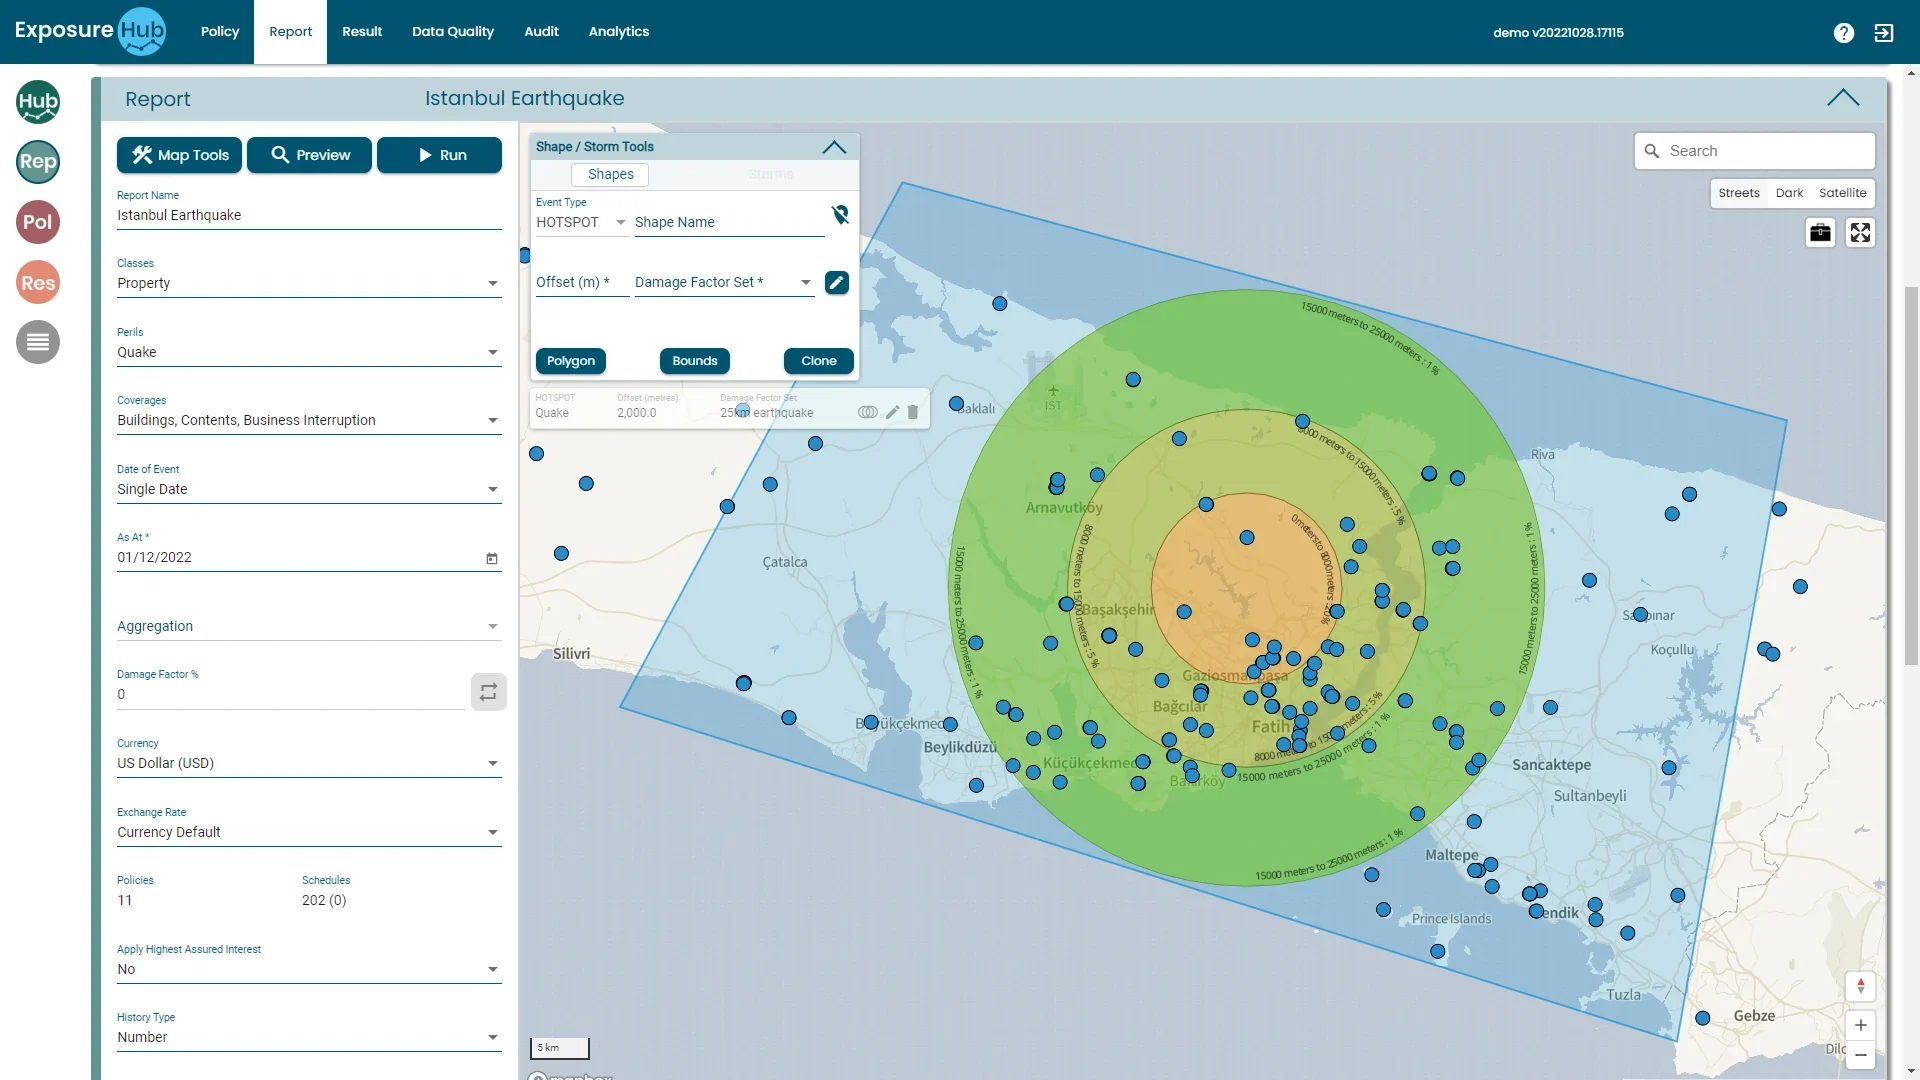
ExposureHub demo environment · sample data
Read the answer, location by location.
Policies, ground-up, gross and net, with the map keyed to the damage bands, so you can see which locations sit in which band.
- Ground-up, gross and net by policy
- The PML key beside the map
- Every location inside each band
ExposureHub demo environment · sample data
Deploy what you need, expand over time.
Mapping, accumulation and scenarios are the core of the platform. The DQ Module and ConfigHub sit alongside it, configurable by client and by user.
Multiple lines, one platform.
Marine, aviation, property, energy and specialty, with inwards and outwards reinsurance programs, each configured to its own schedules.
Know what is sitting in every port
Marine exposure gathers where the ports are. In ExposureHub you create a marine line of business, import your policies against it and run events over the book, with the location of ports on the map.
The question it answers
How much exposure do we have around this port?
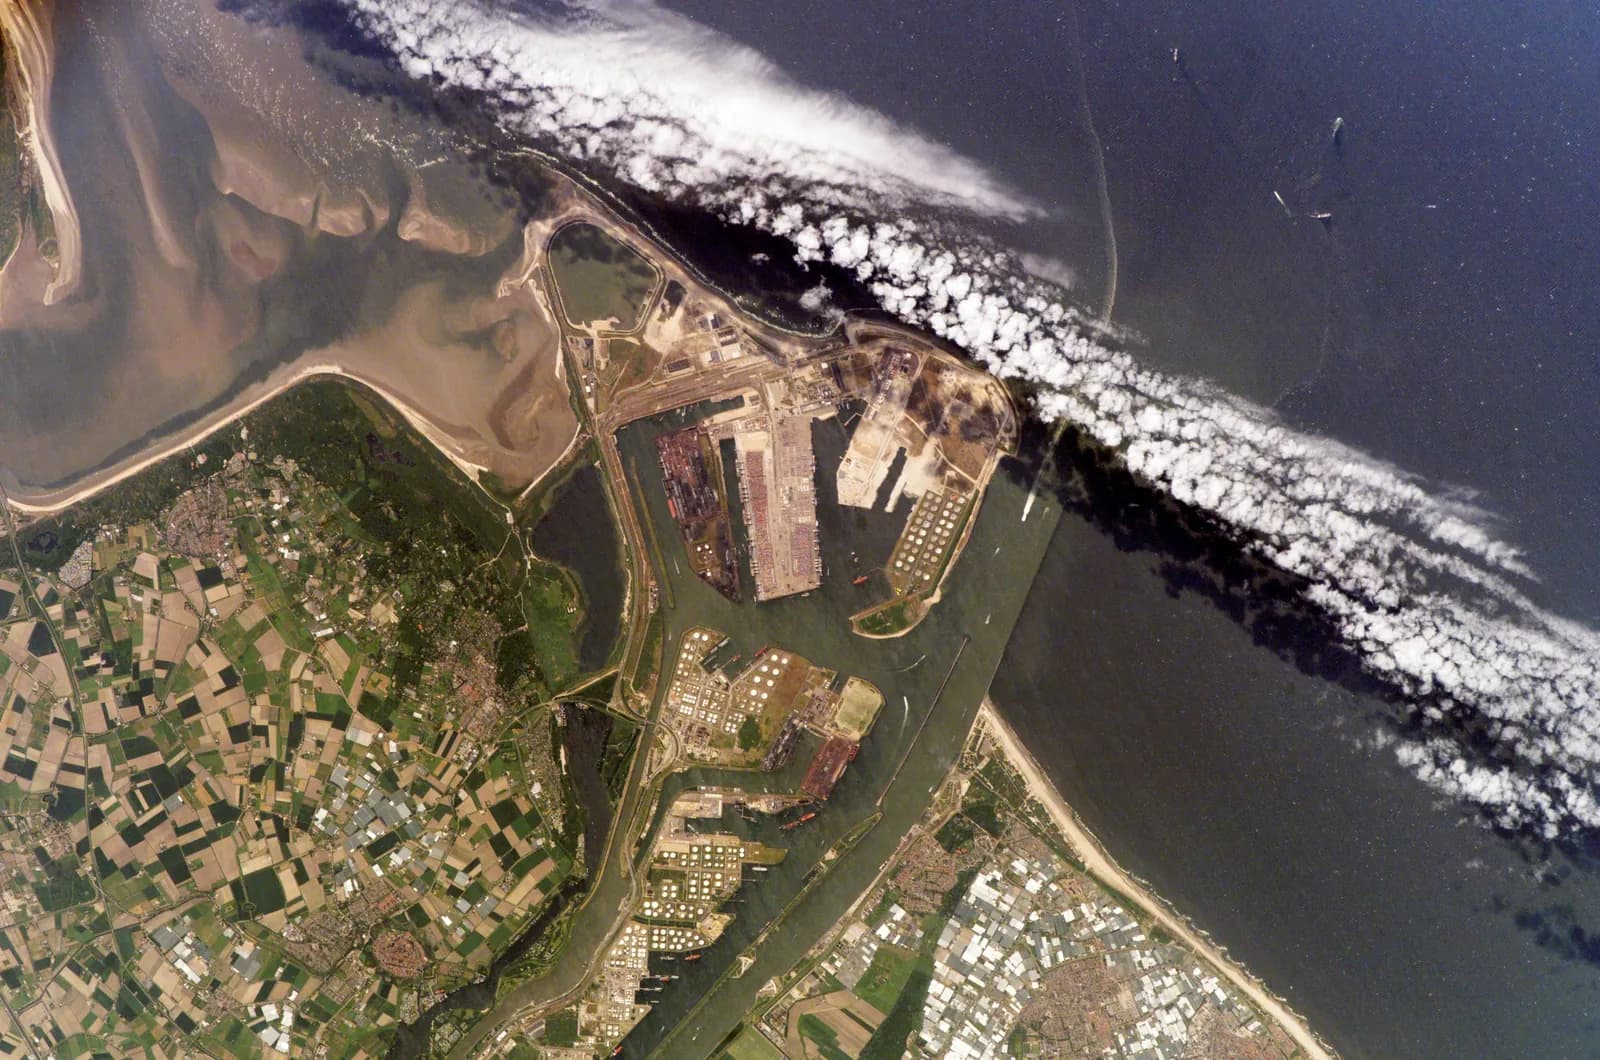
Ports and terminals
Exposure concentrated around the same port, with the location of ports on the map.
Your own line of business
Marine policies imported against a marine line of business you create.
Events over the book
Events run against the marine book using the parameters you set.
Reporting that used to take weeks, now takes hours.
A fast-growing specialty MGA writing on behalf of other carriers owes each of them reporting. It went live one class at a time and now runs all seven of its classes on ExposureHub.
classes of business live, from one template
“ExposureHub has become the cornerstone of our Catastrophe risk management strategy, ensuring that we not only identify potential exposures but proactively mitigate them.”
Managing Director
Specialty MGA customer

went live first, so the template existed from day one

exposure management stakeholders in the project team
go-live, Phase 2 within three months, then longer term
Thinking from the exposure team.
 Ebix Europe
Harnessing the power of data for real-time risk management
Global insured losses from natural disasters have run well above the 21st-century average, with US severe convective storm losses above $50 billion for the first time. Exposure management has never been more critical, and the industry is moving towards real-time.
Empowering insurance agility: technology's crucial role in advanced exposure management
What good looks like: integration of third-party data, post-event exposure management, accessible tools, modular platforms and a new standard in processing speed across multiple lines and inwards and outwards reinsurance programmes.
ExposureHub and the roadmap to exposure management success
Brilliant customer service, excellent training and application support are two feedback trends the team regularly hears. Clients' suggestions drive the roadmap, with future modules in development.

See your exposure portfolio in one clear view.
One call is enough to scope whether ExposureHub fits your program. Bring a schedule and the question your team finds hardest to answer.
Short on time? ExposureHub in sixty seconds.